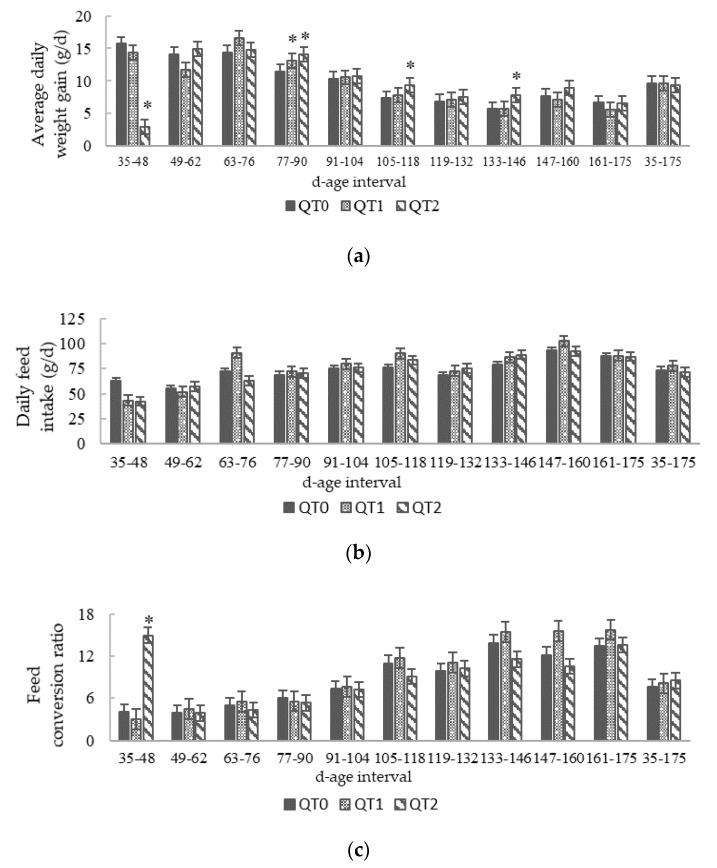
Figure 2.
Trends in: (a) Average daily weight gain; (b) Daily feed intake; (c) Feed conversion ratio from birds fed different levels of QT (mean ± SEM) for a 140-day period starting from 35 days old. * Indicates a difference between treatment and QT0 (Dunnett’s t-test, p < 0.05). QT0 = basal diet; QT1 and QT2 = the basal diet supplemented with QT at 1% and 2%, respectively.

