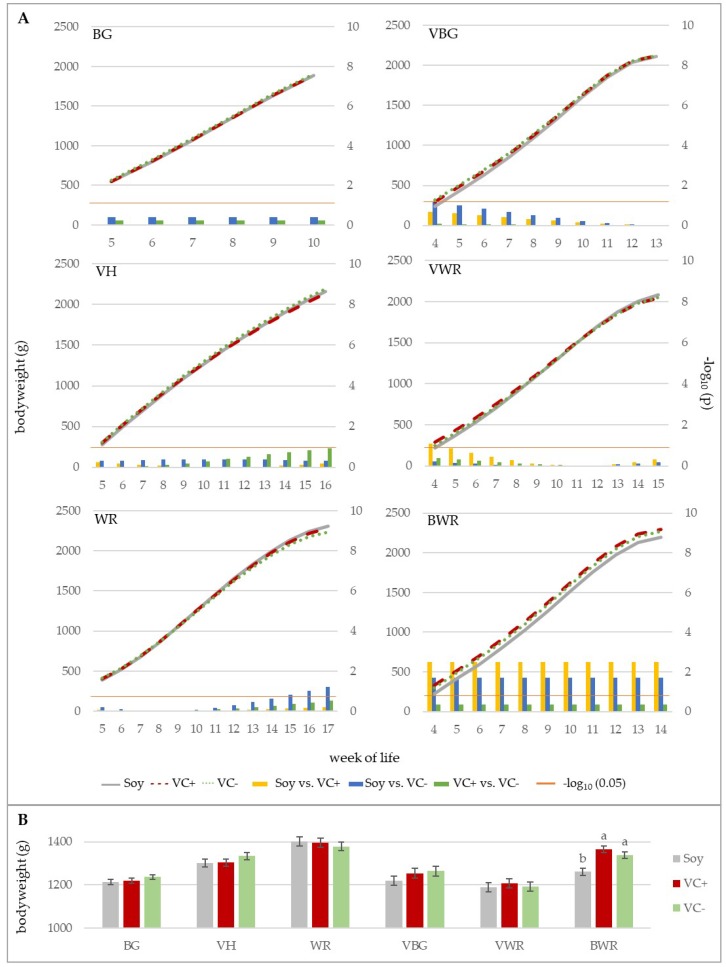
Figure 2.
Effect of feeding treatment on bodyweight development within genotypes (A) and LSMEANS ± SE for the effect of feeding treatment within genotypes adjusted by the mean of age (B). In A, curves show bodyweight development for the respective feeding groups. The bar charts exhibit the differences between LS-means of the different combinations of feeding groups on a weekly base. The orange line represents the significance threshold of p = 0.05. Bars that cross this line imply significant differences between feeding groups in the respective week. In B bars with different letters within one genotype show significant differences (p < 0.05).

