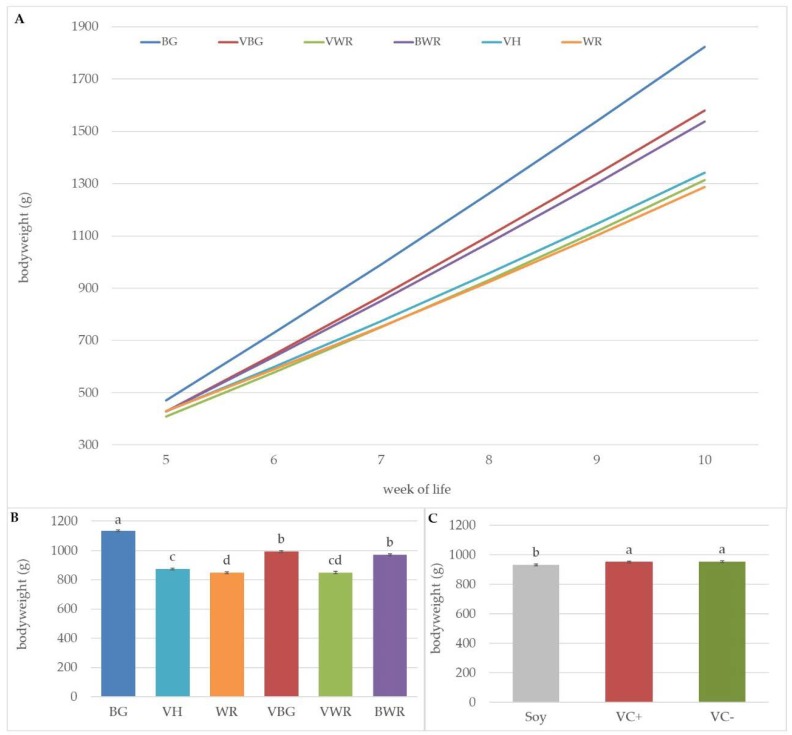
Figure 3.
Comparison of the genotypes from week of life five to ten. (A) Effect of genotype on weight development. (B) LS-means ± SE for bodyweight of the respective genotypes adjusted by the mean of age. (C) LS-means ± SE for bodyweight of the different feeding groups adjusted by the mean of age. a,b,c,d Genotypes not sharing a letter differ at p < 0.05.

