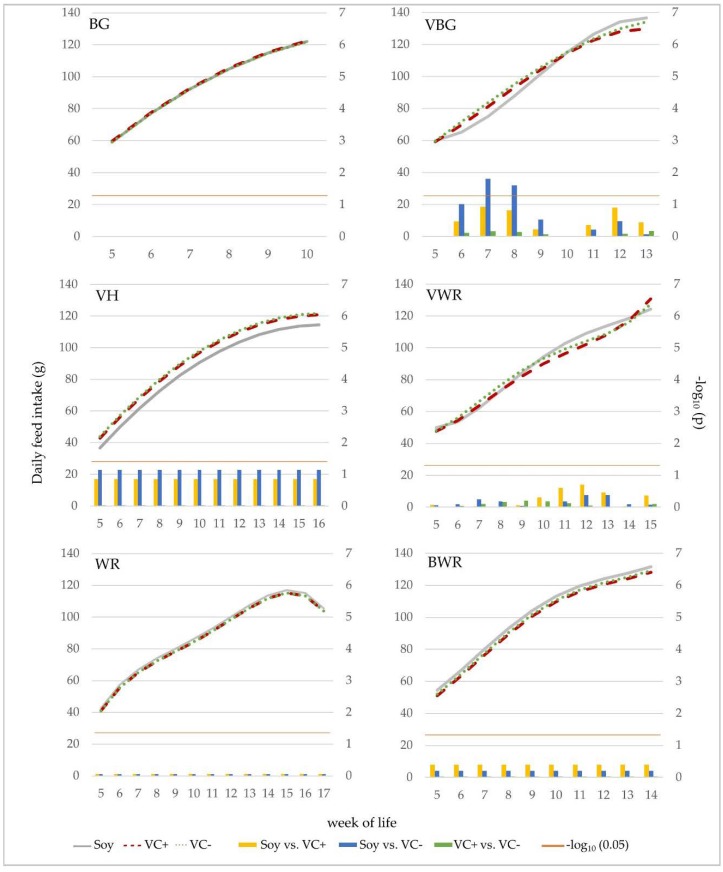
Figure 4.
Effect of feeding treatment on daily feed intake (DFI) within genotypes. Curves show development of DFI for the respective feeding groups. The bar charts exhibit the differences between LS-means of the different combinations of feeding groups on a weekly base. The orange line represents the significance threshold of p = 0.05. Bars that cross this line imply significant differences between feeding groups in the respective week.

