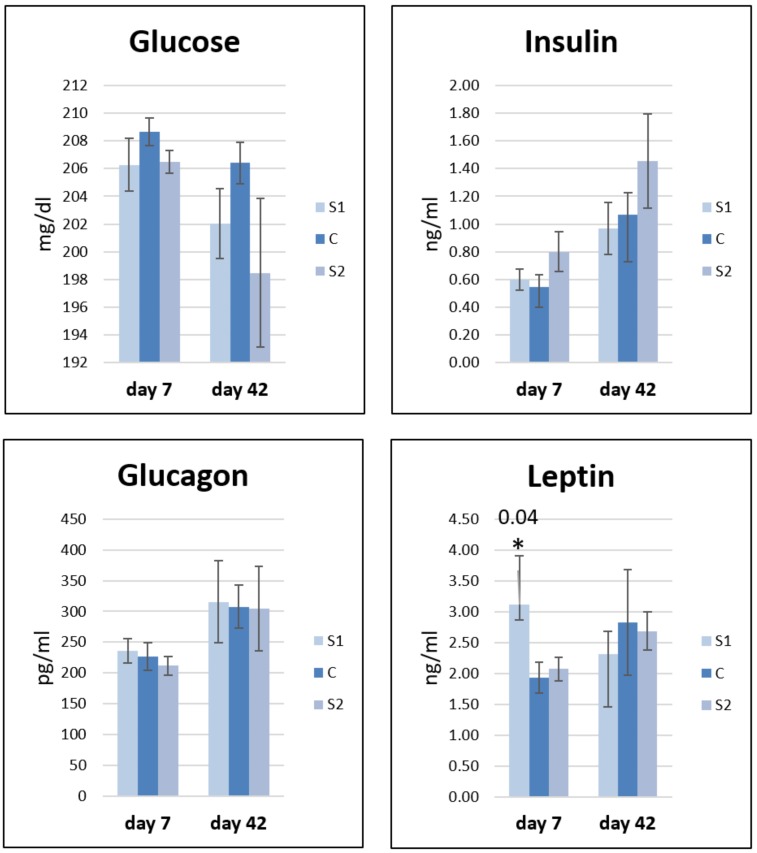
Figure 4.
Changes in biochemical (glucose) and hormonal (insulin, glucagon, and leptin) profiles in response to an early stimulation in ovo with synbiotics (S1) Lactobacillus salivarius with GOS or (S2) Lactobacillus plantarum with RFO and saline as the control (C). Statistical analysis consisted of comparing the experimental groups with the control group by Student’s t-test (* for p < 0.05; exact p value). Standard errors of the mean (SEM) are marked with the lines; n = 8.

