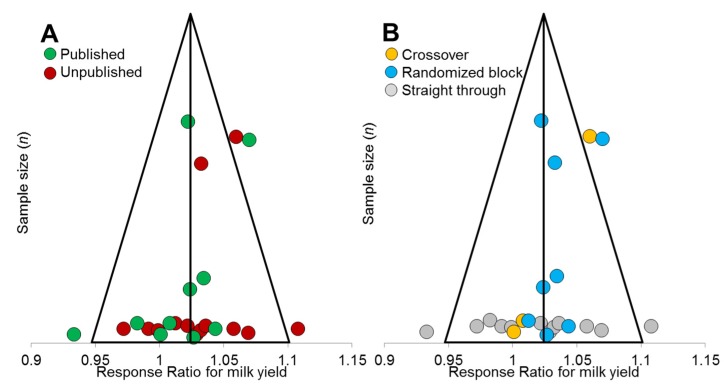
Figure 2.
Funnel plot for all studies included in the meta-analysis of milk yield (n = 23) in order to detect bias between published and unpublished studies (A) or between experimental designs (B). Triangles represent the median Response Ratio (R) and a range equivalent to two standard deviations. If no publication bias is present, the data-points will be organized symmetrically.

