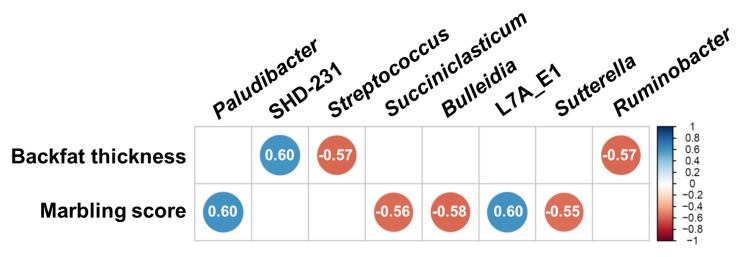
Figure 6.
Correlation coefficient matrix between meat quality measurements and relative abundances of major bacterial genera each found in more than 50% of the 14 rumen samples. Only significant correlations (p < 0.05, |r| > 0.5) are shown. The degree of correlation coefficients are shown using both the color and size of the circles based on the color key on the right side.

