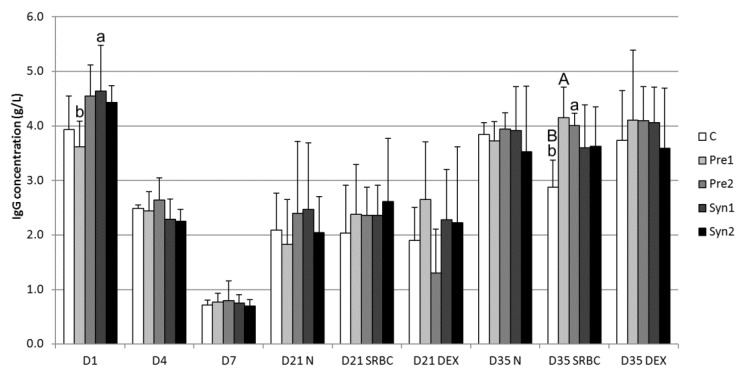
Figure 2.
Serum IgG concentration (mean ± SD) in chickens between the 1st day (D1) after hatching and 35th (D35) day of life: C – control, Pre1 – prebiotic 1, Pre2 – prebiotic 2, Syn1 – synbiotic 1, Syn2 – synbiotic 2, N – untreated groups, SRBC – SRBC-treated groups, and DEX – dextran-treated groups; significant difference A,B: p < 0.01; a,b: p < 0.05. The differences between D1 and D7 in the relevant groups were significant (p < 0.001), as well as between D7 and D35N (p < 0.01).

