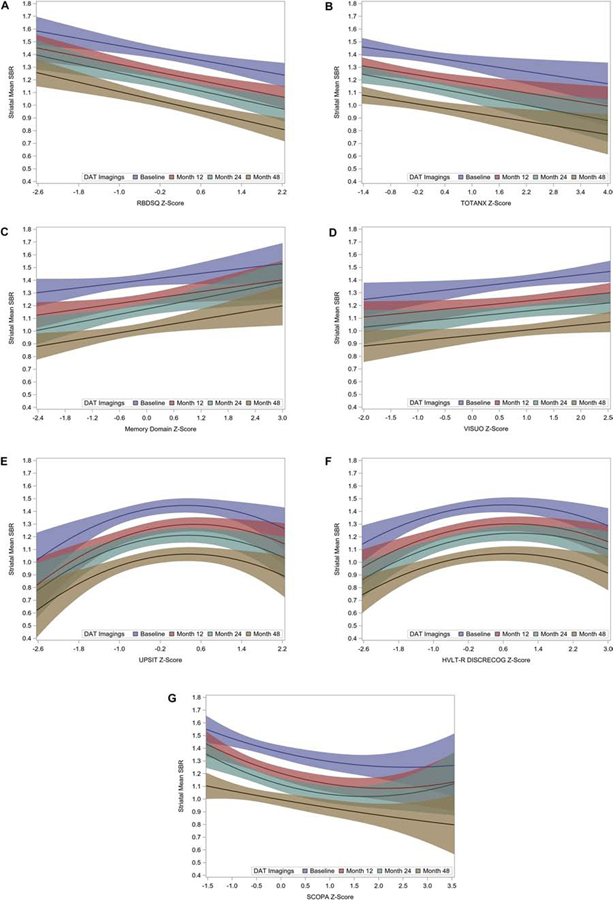
Figure 1.
Relationships among mean striatal specific binding ratio (SBR) at baseline and follow-ups and NMS z-scores. Color coding indicates the time of DAT imaging; the four time-point-specific slopes for each NMS were not significantly different statistically (p>0.1). Shading represents 95% confidence bands for each time-point-specific regression. A) REM Sleep Behavior Disorder Screening Questionnaire (RBDSQ), B) Total Anxiety (State-Trait Anxiety Inventory for Adults (STAI)), C) Memory Cognitive Domain, D) Visuospatial Cognitive Domain, E) University of Pennsylvania Smell Identification Test (UPSIT), F) Hopkins Verbal Learning Test – Discrimination Recognition, G) Scales for Outcomes in Parkinson’s Disease-Autonomic Questionnaire (SCOPA-AUT). In A) through D), fitted models have separate intercepts and slopes for each imaging time but no curvature. In E) and F), fitted models have separate intercepts and slopes for each imaging time but a common curvature parameter; in G), fitted model has separate intercepts, slopes, and curvature parameters for each imaging time.

