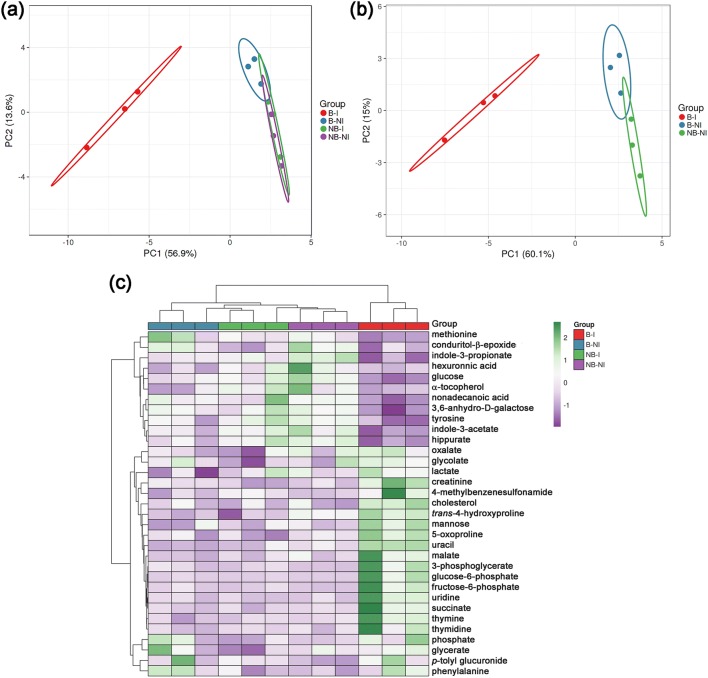
Fig. 1.
Metabolomic multivariate analysis of the mice plasma. a Principal component analysis (PCA) of the serum metabolomes from the 4 experimental groups (n = 3 for each group). PCA shows the distinct clustering of B–I samples separated from control groups. b PCA of the serum metabolites repeated without the NB–I group shows distinction of the B–NI group from the NB–NI group. c Heatmap and hierarchical clustering analysis of the serum metabolomes. Columns represent samples within each group and the rows show the different metabolites. Color scale implies the abundance of metabolites; green for higher abundance, purple for lower abundance

