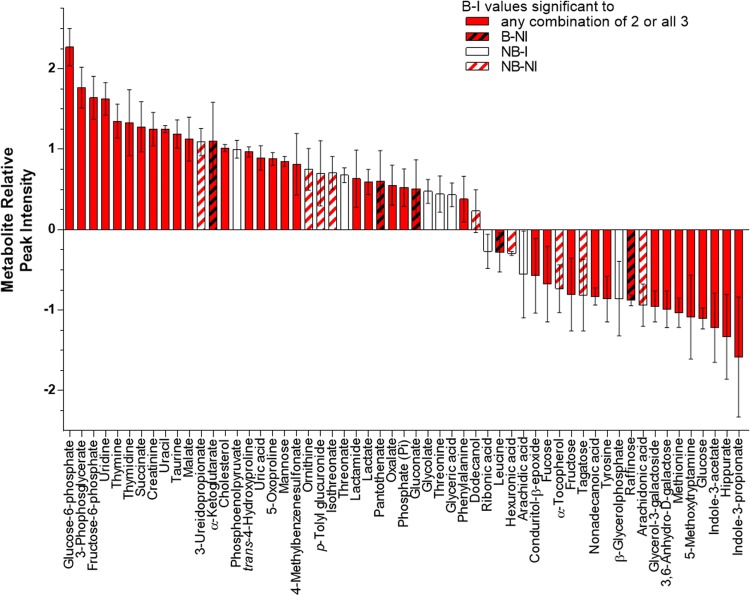
Fig. 2.
Thermal injury and P. aeruginosa infection significantly increased or decreased the abundance of 58 metabolites in murine sera. Peak intensities were normalized using vector and median normalization methods and significance was determined by comparing B–I, B-NI, and NB–NI groups using one-way ANOVA followed by Fisher’s least significant difference test. Metabolites with P ≤ 0.05 are displayed from highest relative peak intensity to the lowest. Each bar represents 3 biological samples ± SEM. B–I, thermally injured/infected (Pa-sepsis); B-NI, thermally injured/not infected (niSIRS); NB–I, not injured/infected (control); NB-NI, not injured/not infected (sham control)

