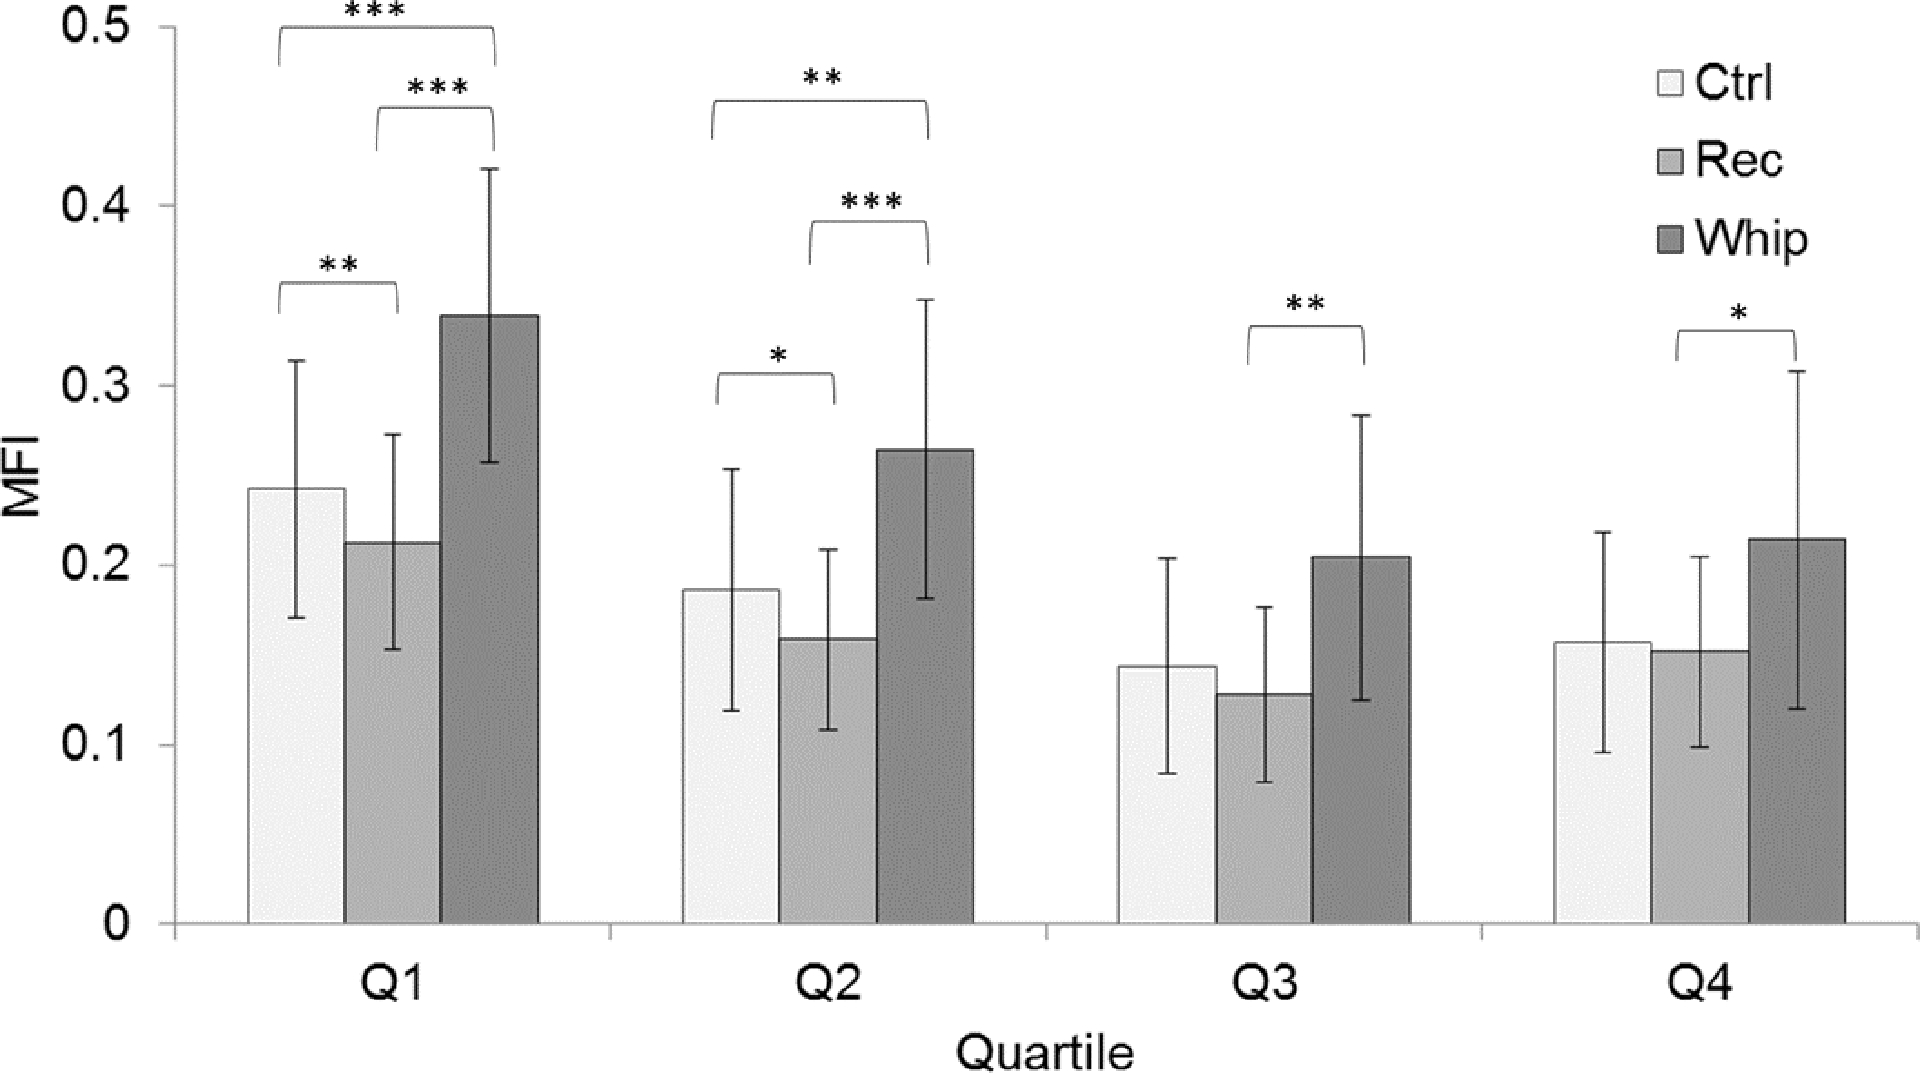
FIGURE 3.

MFI means and standard deviations for between group comparisons at each quartile (Q1- medial, Q4- lateral) averaged over all cervical levels. The values are estimated marginal means and were based on the covariate values of age = 32.8 years, Body Mass Index (BMI) = 27.27 kg/m2, and cervical level = C4. Significance is denoted as * for P<.05, ** for P<.01, and *** for P<.001.
