Fig. 4.

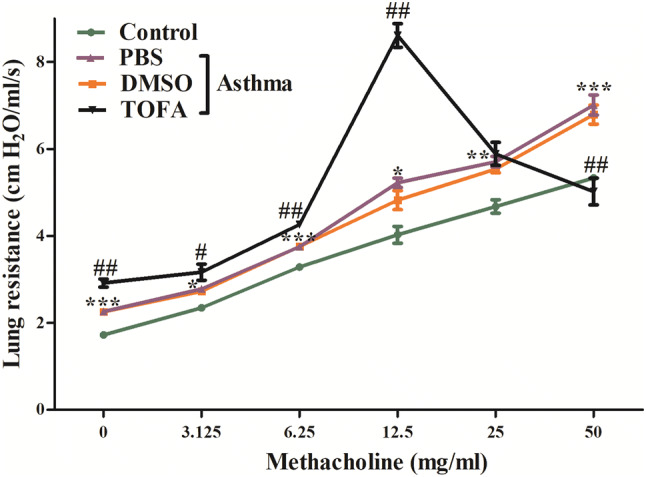
Increased airway resistance in TOFA-treated asthma mice. *Control vs PBS/Asthma, #TOFA/Asthma vs PBS/Asthma. All data are represented as mean ± SEM (n = 5 mice per group). *p < 0.05, **p < 0.01, ***p < 0.001, #p < 0.05, ##p < 0.001

Increased airway resistance in TOFA-treated asthma mice. *Control vs PBS/Asthma, #TOFA/Asthma vs PBS/Asthma. All data are represented as mean ± SEM (n = 5 mice per group). *p < 0.05, **p < 0.01, ***p < 0.001, #p < 0.05, ##p < 0.001