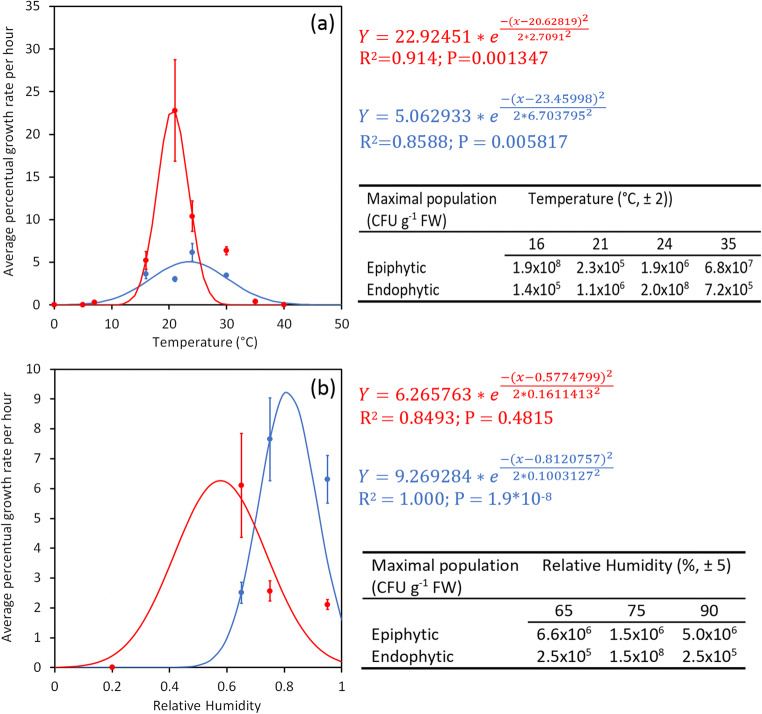
Fig. 8.
Influence of temperature (a) and relative humidity (b) on Pseudomonas syringae pv. actinidiae growth in planta. The endophytic (blue) or epiphytic (red) growth rate at each temperature or humidity is the average of hourly increase of Psa population at the different time points. Only the points showing an exponential growth phase have been considered. The maximal bacterial population attained in the different conditions is also reported. Regression curves for the influence of temperature and humidity on endophytic and epiphytic pathogen growth were also calculated. For each of the regression curve, R2 and p values are reported. Standard errors are shown

