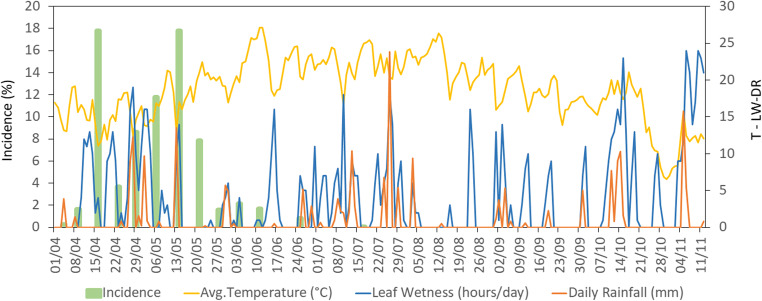
Fig. 9.
Incidence of Pseudomonas syringae pv. actinidiae primary symptoms in A. chinensis var. deliciosa (cv ‘Hayward’) in relation to daily average temperature, leaf wetness and rainfall. Symptom development had a peak from April to May and almost stopped thereafter. The presented data are calculated as the average of three locations during 2014. Bud break occurred at March 26. Experiments performed in 2013 and 2015 provided comparable results

