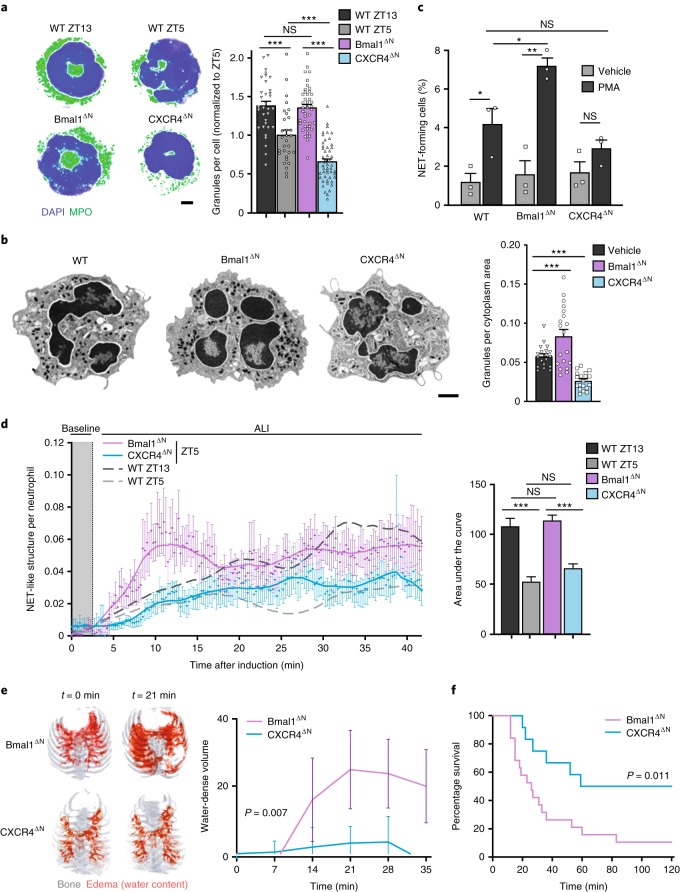
Fig. 5. Diurnal degranulation and pulmonary protection is neutrophil intrinsic.
a, Confocal micrographs (left) and quantification (right) of primary granules in neutrophils from WT mice at night (ZT13, n = 33 cells from three mice) or daytime (ZT5, n = 30 cells from three mice), and from mutant mice (n = 50 cells from three CXCR4∆N mice and 41 cells from three Bmal1∆N mice, both at ZT5); scale bar, 2 μm. b, TEM images (left) and quantification of electrodense azurophilic granules (right) in WT and mutant mice (all at ZT5), showing increased granule content in Bmal1∆N and reduced in CXCR4∆N neutrophils compared with WT cells; n = 19 cells from three mice each; scale bar, 1 μm. c, Ex vivo NET formation in sorted WT, Bmal1∆N or CXCR4∆N neutrophils stimulated with PMA or vehicle as control; n = 3 mice per condition. d, Quantification of NET-like structures normalized to the number of neutrophils during ALI in Bmal1∆N (purple line) or CXCR4∆N (blue line) mice. Time course and elevations from baseline (gray area) are shown in the left panel, and the areas under the curve are shown in the right panel (individual data points are not shown here as this graph uses a mean ± s.e.m. value for the area under the curve calculated from the data shown in the left panel). Experiments were performed at ZT5. Data from wild-type mice at ZT5 (light gray, dashed) and ZT13 (dark gray, dashed) from Fig. 4c are shown for reference; n = 15 fields from three mice for each condition. e, Representative images of longitudinal CT series of edema (red) in mutant mice subject to ALI (left) at ZT5, and quantification of the edema volume over time (right); n = 7 mice per genotype. f, Survival curves for Bmal1∆N (n = 19 mice) and CXCR4∆N (n = 12 mice) mice subjected to ALI at ZT5. Data are shown as mean ± s.e.m. *P < 0.05; **P < 0.01; ***P < 0.001; NS, not significant, as determined by one-way ANOVA with Dunnet’s multiple comparison test (a–d), two-way ANOVA (e) or two-sided log-rank (Mantel–Cox) test (f).

