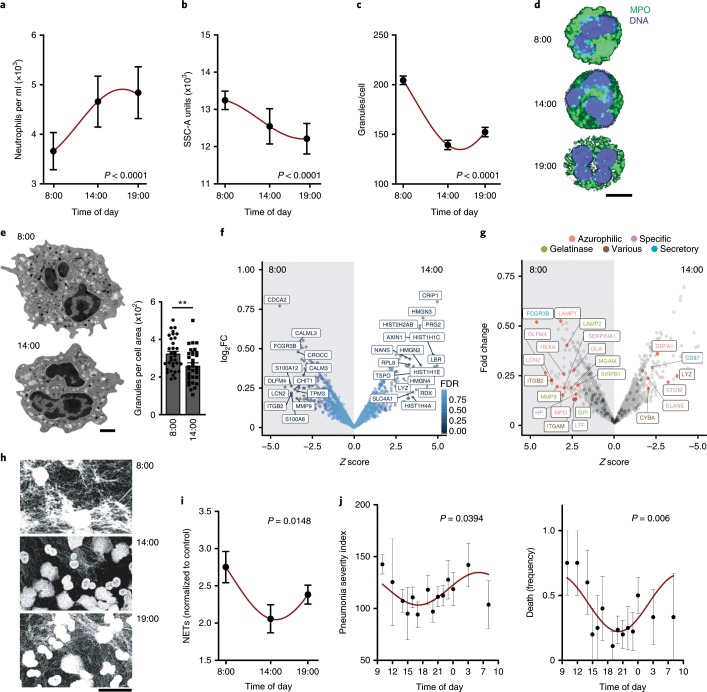
Fig. 6. Evidence for neutrophil disarming and pulmonary protection in humans.
a, Blood neutrophil counts in human volunteers at the different time points; n = 10 human volunteers per time point. b, Light-scattering (SSC-A) values for human neutrophils at different times, as measured by flow cytometry; n = 10 human volunteers. c, Quantification of primary granules from confocal images of human neutrophils from images in d; n = 150 cells from ten volunteers per time point. d, Representative images of granule content of human neutrophils, quantified in c. e, Transmission electron micrographs (left) of human neutrophils in the morning (8:00) and early afternoon (14:00), and quantification (right) showing reduced numbers of electrodense primary granules; n = 33 cells from three human volunteers per time point. f, Volcano plot of the human neutrophil proteome analyzed at 8:00 and 14:00, showing proteins with P < 0.001 (see Methods for human TMT proteomics). A negative Z score represents higher values at 8:00 over 14:00 neutrophils; n = 5 per time point. g, Volcano plot of granule proteins in the human neutrophil proteome, showing higher content in granule proteins (color-coded) at 8:00 compared with 14:00; n = 5 samples from healthy volunteers. Red dots and labels show differentially expressed proteins with P < 0.05, and black dots show all granule proteins. Label color indicates the granule type in which the protein is normally found (top right). h,i, Representative confocal images (h) and quantification (i) of ex vivo NET formation by human neutrophils stimulated with PMA or vehicle at the indicated time points; n = 10 volunteers per time point. j, ARDS severity shown as the pneumonia severity index (left) and intrahospital deaths (right) of patients entering the intensive care unit at different times of the day; n = 125 patients. Data are shown as mean ± s.e.m. **P < 0.01, as determined by unpaired two-tailed t-test analysis (f). P values for the circadian plots were calculated by the amplitude versus zero two-tailed t-test analysis (a–c,g,i). Maroon line in a–c, g and i shows the nonlinear COSINOR fit of the data.

