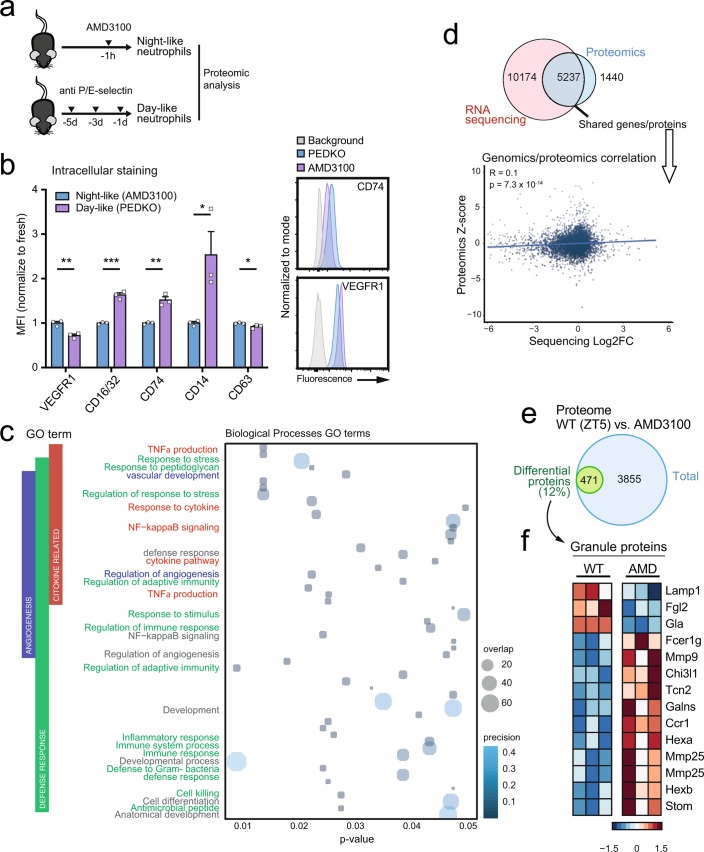
Extended Data Fig. 1. Validation and analysis of neutrophil proteomics.
a, Experimental strategy for proteomic analysis of day-like (from P- and E-selectin treated mice) and night-like (from AMD3100-treated mice) neutrophils isolated by negative selection (see methods) from blood. b, Intracellular staining of proteins from the proteomics dataset for validation in fresh (blue) and aged (violet) neutrophils obtained as indicated in a. All the proteins analyzed correlated with the proteomics data; n = 3 mice per condition. c, GO terms of the differentially expressed proteins (FDR<0.05, see methods section for 18O proteomics) in the proteomics dataset, showing terms with p < 0.05 (from single samples of 60 million neutrophils pooled from 9 mice (night) and 6 mice (day)). Bubble size represents overlap of query vs. the GO term. d, Scatterplot, correlation coefficient and significance level (pvalue) of the Spearman’s correlation of the direction of change of common proteins and genes from our proteomic analysis of fresh and aged neutrophils (this paper) and circadian RNA-sequencing data previously reported (Adrover et al. 2019, from 3 mice at ZT5 and 3 mice at ZT13), showing poor correlation of RNA and protein content. e, Venn-diagram showing the number of differentially detected proteins (p < 0.05, see methods section for mouse TMT proteomics) between vehicle- and AMD3100-treated mice (at ZT5); n = 3 samples per group. f, Heatmap showing levels of granule proteins in this dataset, Note increased detection of most granule proteins in neutrophils from AMD3100-treated mice. Data in (b) are shown as mean ± SEM. *; p < 0.05; **, p < 0.01; ***, p < 0.001, as determined by unpaired two-tailed t-test analysis.

