
Fig. 2.
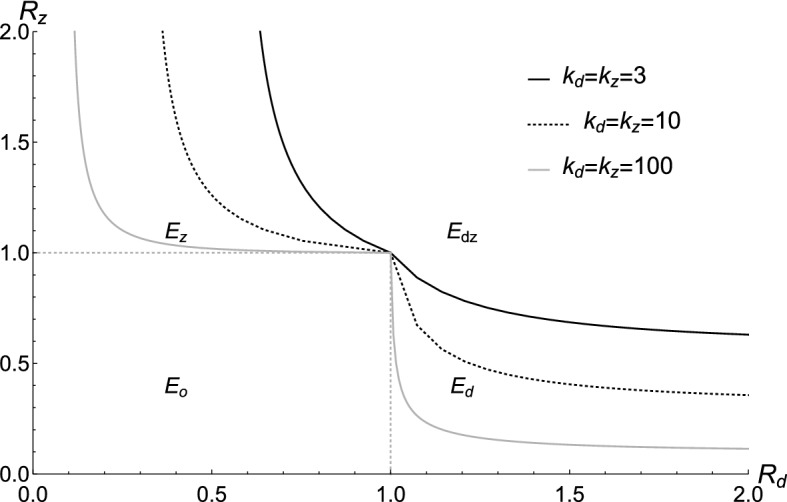
Variations in IRN threshold curves with and . The and parameter values used to generate the IRN threshold curves are as indicated, while other parameter values are kept at their baseline values
Official websites use .gov
A
.gov website belongs to an official
government organization in the United States.
Secure .gov websites use HTTPS
A lock (
) or https:// means you've safely
connected to the .gov website. Share sensitive
information only on official, secure websites.
Variations in IRN threshold curves with and . The and parameter values used to generate the IRN threshold curves are as indicated, while other parameter values are kept at their baseline values