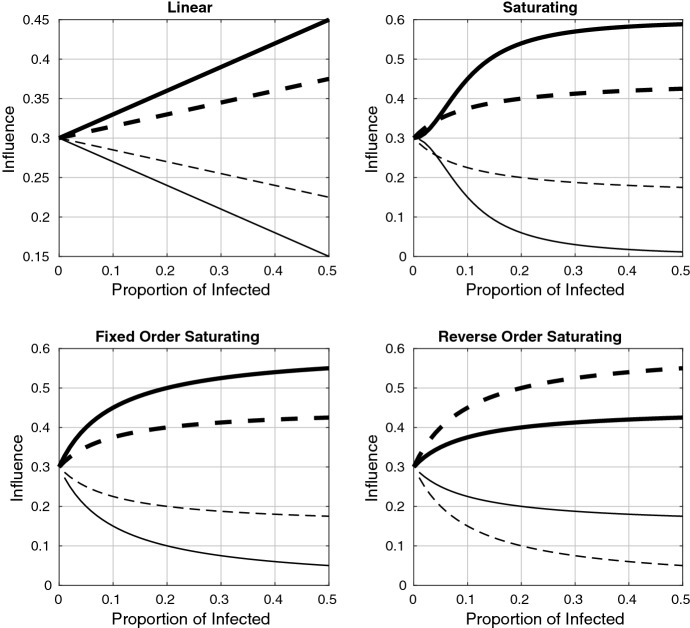
Fig. 1.
Influence functions plotted as a function of the infected proportion, I, for the linear, saturating, fixed-order saturating, and reverse-order saturating cases given in Table 1. The thick/thin lines correspond to the influence of the more/less prophylactic subgroups ( and solid, and dashed). Influence is shown for , so that the behaviour near is more visible. Parameter values are given in Table 2, and the choice of influence functions is explained in the caption of Table 1. Note that the functions are symmetric about because we have used . For , the more prophylactic influence functions increase in magnitude, removing the symmetry

