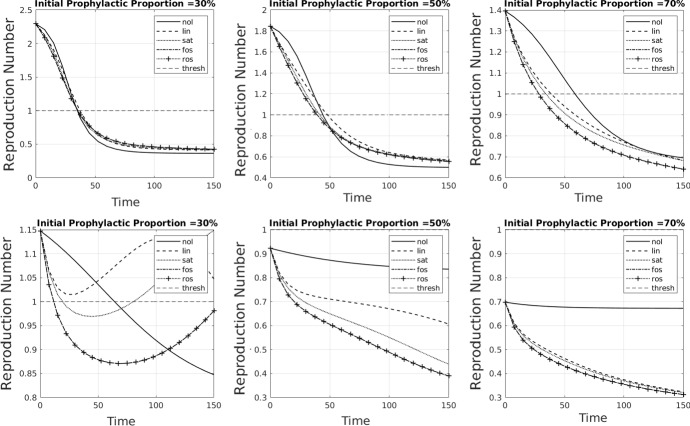
Fig. 10.
Plots showing how the time evolution of the effective reproduction number is affected by shifts within the susceptible subpopulations due to opinion dynamics. In the bottom row, the rate of opinion/disease dynamics has been increased/decreased relative to the top row. Linetypes indicate no influence, i.e. (solid), linear influence (dashed), saturating influence (dotted), fixed-order saturating influence (dash-dotted), and reverse-order saturating influence (dotted with crosses). The epidemic threshold is indicated by a thin horizontal dashed line. Parameter values are all at the default values given in Table 2 except, in the bottom row, and

