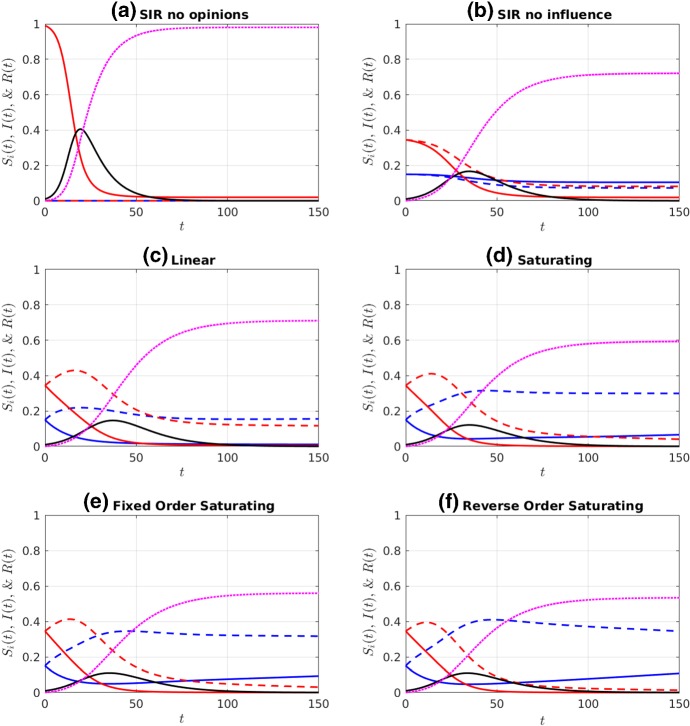
Fig. 2.
Simulations of a non-prophylactic majority initial distribution of the susceptible population ( and ), given an initial infectious population of . Colour legend: red curves are (solid) and (dashed). Blue curves are (solid) and (dashed). Black and purple curves are I(t) and R(t), respectively. Influence functions were a no influence and all susceptible individuals in the population (, ), b no influence (), c linear, d saturating, e fixed-order saturating, and f reverse-order saturating. Influence functions c–f are defined in Table 1. Parameter values are at the defaults listed in Table 2 (Color figure online)

