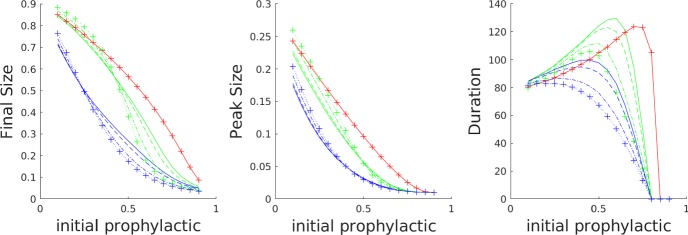
Fig. 5.
Effects of amplification on final size, peak size, and epidemic duration. Three types of influence functions: linear influence (green), fixed-order saturating influence (blue), and no influence (red), each with varying levels of amplification (p): solid (), dashed (, dash-dotted (), and dotted with crosses (. Parameter values are all at the defaults listed in Table 2, except for . The baseline case for comparison is shown in Fig. 4 (Color figure online)

