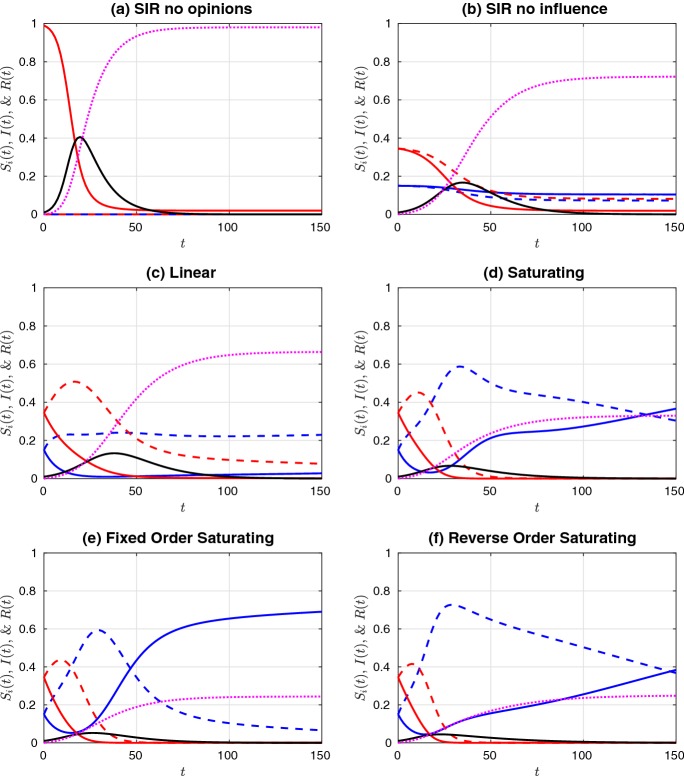
Fig. 6.
Simulations of a non-prophylactic majority initial distribution of the susceptible population ( and ), given an initial infectious population of and faster opinion dynamics. These plots are the same as shown in Fig. 2, except that the opinion dynamics have been sped up by increasing and . Colour legend: red curves are (solid) and (dashed). Blue curves are (solid) and (dashed). Black and purple curves are I(t) and R(t), respectively. Influence functions were a no influence and all individuals in the population (, ), b no influence (), c linear, d saturating, e fixed-order saturating, and f reverse-order saturating. Influence functions c–f are defined in Table 1. Parameter values are at the defaults listed in Table 2, except for and (Color figure online)

