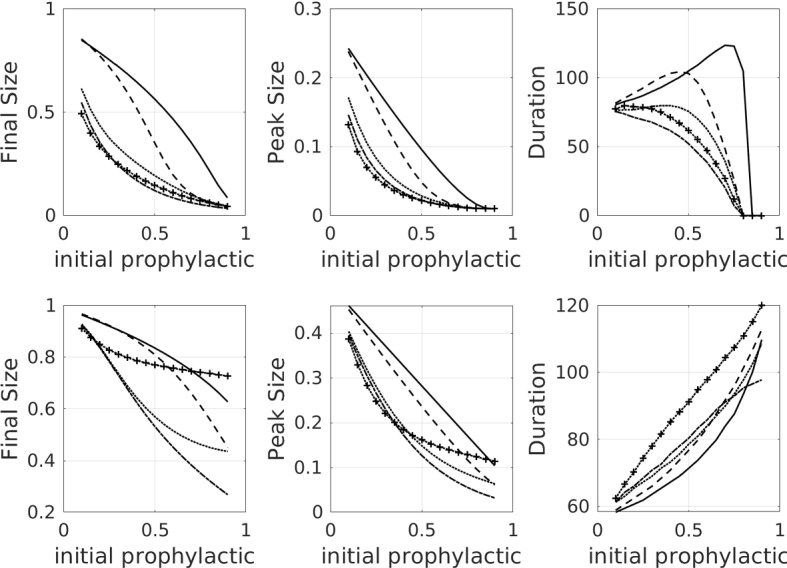
Fig. 8.

The effect of faster opinion dynamics (first row), and faster both opinion and disease dynamics (second row). The baseline case for comparison is shown in Fig. 4. Final epidemic size, peak epidemic size, and epidemic duration as a function of the initial proportion of the population on the prophylactic side, for all of the influence functions listed in Table 1 as well as the no-influence () case. Linestyle legend: solid—no influence, dashed—linear influence, dotted—saturating influence, dash-dot—fixed-order saturating influence, dotted with crosses—reverse-order saturating influence. All parameter values are set to the default values listed in Table 2 except for and (which speed up opinion dynamics), and in the second row (which speeds up disease dynamics)
