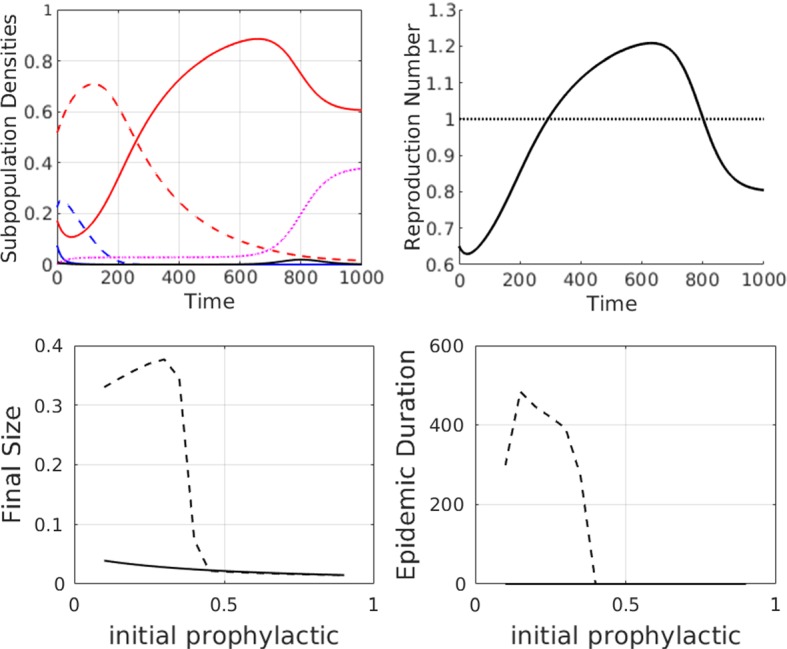
Fig. 9.

First row: simulations to show how opinion dynamics can delay the onset of an epidemic, as compared to the simple SIR case with a single susceptible population . Parameter values are at the defaults as given in Table 2 except . Colour legend for the top left subplot: red curves are (solid) and (dashed). Blue curves are (solid) and (dashed). Black and purple curves are I(t) and R(t), respectively. Numerical solutions are shown for the full model with fixed-order saturating influence. Susceptible attitudes are initially distributed as a “non-prophylactic majority” where , , and . The effective reproduction number, , is shown in the top right subplot. The horizontal line indicates the epidemic threshold above which . Second row: summary data plots showing how the final size, peak size, and duration of the epidemic vary as a function of the initial population proportion that is more prophylactic (). Dashed line: full model with fixed- order saturating influence and solid line: SIR model with distribution of susceptibles but no interactions (). Note that epidemic duration is zero for all initial distribution of susceptibles if there is no interaction between susceptible groups (Color figure online)
