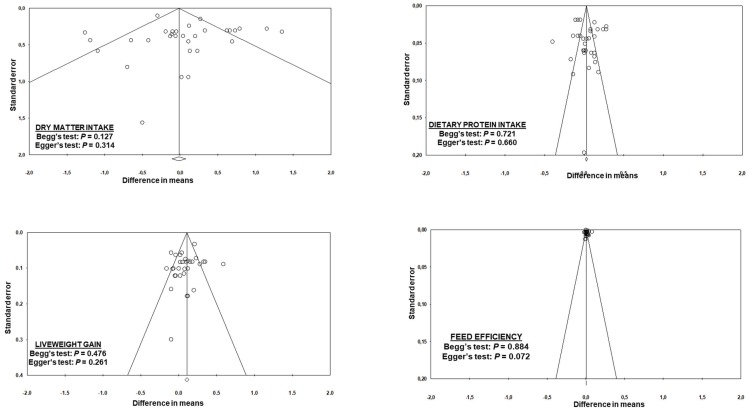
Figure A1.
Funnel plots of raw mean differences (difference in means) against their inverse standard errors and the associated significance (p-value) for testing the publication bias of the studies included in the meta-analysis. Open circles represent individual study comparisons included in the meta-analysis.

