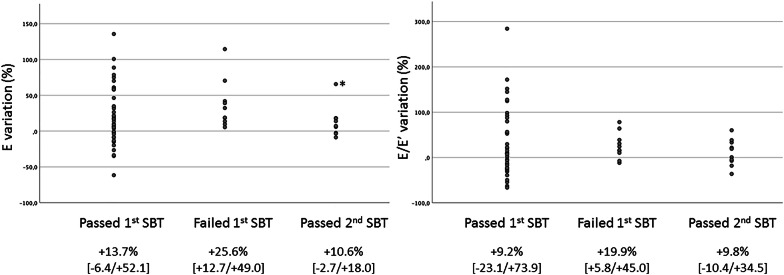
Fig. 3.
Variations of E wave velocity and E/E′ induced by spontaneous breathing trials (SBT) in patients who succeed at the first attempt and in those who failed during the first weaning trial but then successfully passed the second SBT after an echocardiography-guided therapy. Results are expressed in percentages of baseline values (positive-pressure ventilation). *: despite a large SBT-induced increase in E wave velocity during the second (successful) weaning trial in this patient, the absolute value of E wave was markedly lower when compared to the first (failed) SBT: baseline 2 = 65 cm/s and SBT 2 = 103 cm/s vs. baseline 1 = 88 cm/s and SBT 1 = 122 cm/s

