
Figure 1.
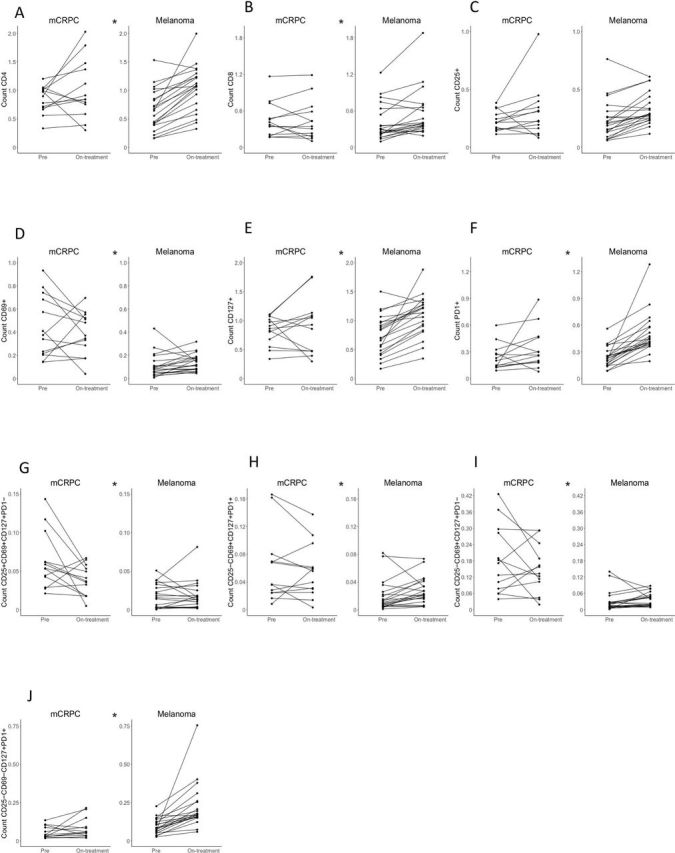
Modulation of different T-cell populations for mCRPC and melanoma patients with treatment. T-cell counts for specific populations were assessed by flow cytometry pretreatment after one cycle of treatmemt. (A) The count of CD4+ T cells. (B) The count of CD8+ T cells. (C) The count of CD25+ T cells. (D) The count of CD69+ T cells. (E) The count of CD127+ T cells. (F) The count of PD1+ T cells. (G) The count of CD25+CD69+CD127+PD1− T cells. (H) The count of CD25−CD69+CD127+PD1+ T cells. (I) The count of CD25−CD69+CD127+PD1− T cells. (J) The count of CD25−CD69−CD127+PD1+ populations. Each figure has two panels representing mCRPC (left) and metastatic melanoma (right). Each panel plots the population count at baseline and on-treatment with connected lines for each patient. The figures with * indicate that there is a significant difference in the ratio of on-treatment count and baseline count of each respective T-cell population between mCRPC and melanoma patients (p<0.05). mCRPC, metastatic castration resistant prostate cancer.