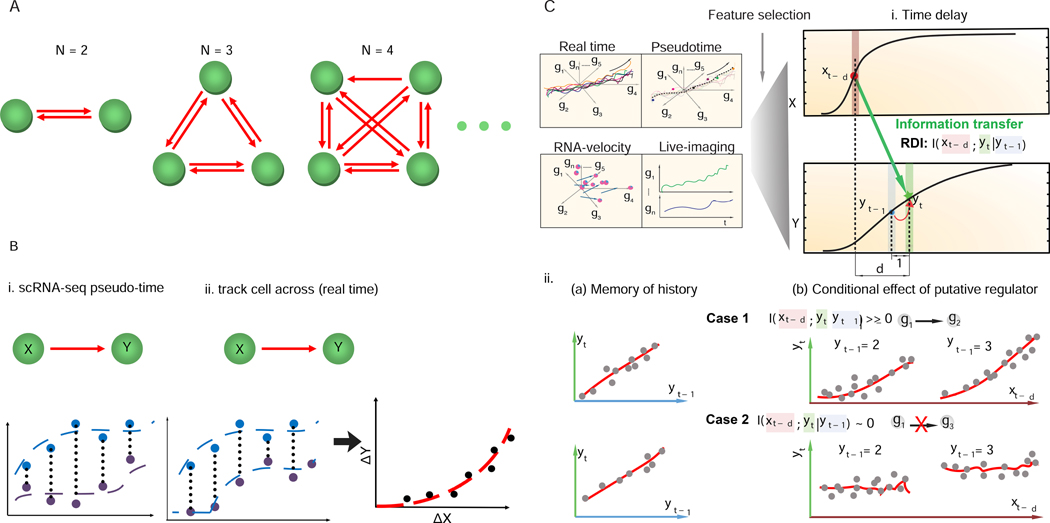
Figure 1: Scribe, a toolkit for inferring and visualizing causal regulations.
(A). Inferring regulatory networks from gene expression data is challenging because the number of regulatory interactions that must be evaluated grows much more quickly than the number of genes in the analysis. (B) Ordering single-cell data in “pseudotime” or tracking how fluctuations in a regulatory are followed by changes in a putative target in the same individual cells could boost power to detect causal regulatory interactions. (C) Scribe detects causality from four types of single cell measurement (“pseudotime”, “live-image”, “RNA-velocity” and “real-time”) datasets with a the metric, restricted directed information (RDI). Scribe relies on RDI (Rahimzamani and Kannan, 2016) to quantify the information transferred from the potential regulator to the target under some time delay while conditioned over its past on this pseudo-time series data. A gene often has strong memory to its intermediate previous state (Yt−1) but RDI will only give highly positive causality score from the putative regulator to target in cases where there is still a strong relationship between the regulator’s history and the target’s present conditioned on target’s history (Case 1 vs. Case 2).

