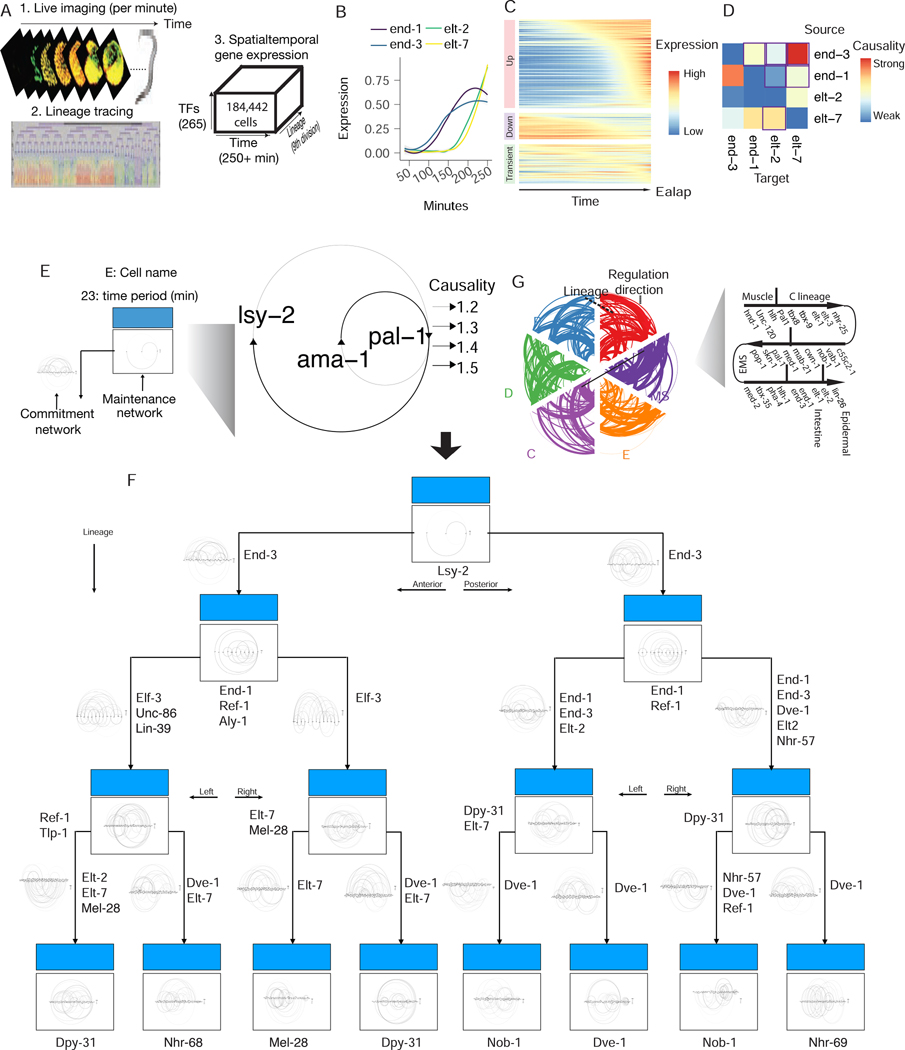
Fig 2: Live imaging dataset of C. elegans’ early embryogenesis captures transcription expression dynamics hierarchy.
(A) Scheme used by Murray et al for measuring transcription factors protein expression dynamics in real-time for every cell during early C. elegans embryogenesis. (B) Single cell lineage-resolved fluorescence data captures temporal dynamics of E lineage master regulators during C. elegans embryogenesis. The expression for each gene is scaled to be between 0 and 1 and then smoothed using LOESS regression, same in C. (C) Expression dynamics for 265 report TFs along the lineage leading to the Ealap cell. (D) Scribe reconstructs the causal regulatory network for the four master regulators (end-1/3, elt-2/7). Note that the outlined box corresponds to the previously known regulations. (E) A scheme for the multi-scale network for panel B. (F) An integrative multiscale model for the E lineage specification. Zoom in to see the network architecture in details. (G) Lineage (AB, P, MS, E, D, C) specific causal networks for the curated master regulators constructed with Scribe shown as a hiveplot.

