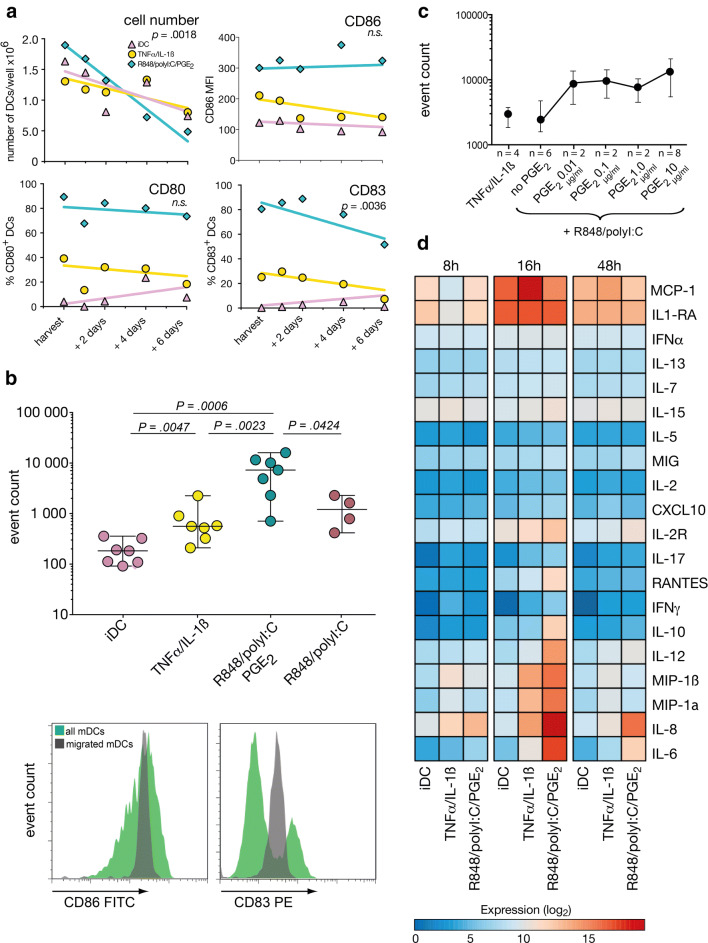
Fig. 2.
Stability, migration, and cytokine secretion of differentially matured DCs. a After harvesting on day +7, DCs were maintained, counted, and phenotyped for another 6 days. Gating strategy is detailed in supplementary Fig. 1a. Each symbol represents the median of n = 5 experiments, differences of slopes were calculated by linear regression. b Number of DCs migrating along a CCL19/21 gradient in a transwell assay. Gating strategy for identifying DCs is detailed in supplementary Fig. 1b. Line and error bars represent medians and ranges, each symbol represents one experiment. Histograms show representative examples of CD86 and CD83 expression on all vs. migrated DCs. c DCs were matured with titrating doses of PGE2 and assayed for targeted migration as described above, medians with ranges. d Heat map of cytokine concentrations in supernatants after 8, 16 and 48 h of maturation. Data from n = 7, n = 3 and n = 10 experiments, respectively were log2-transformed

