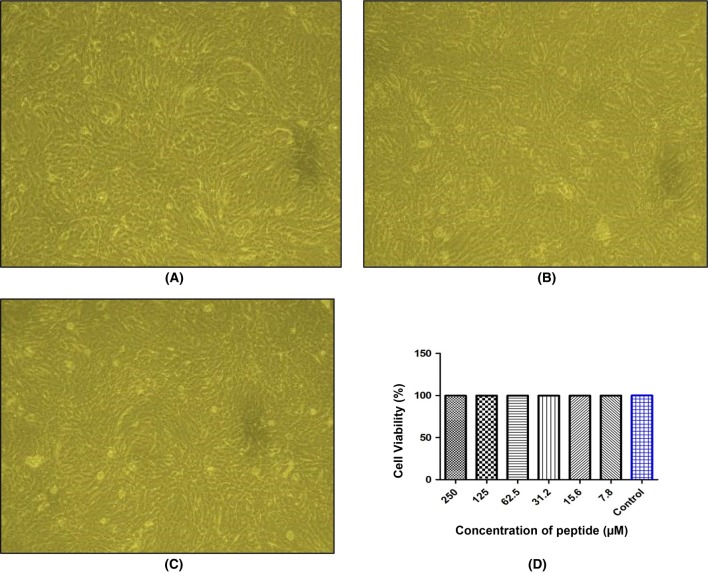
Fig. 5.
NL13 induced cell viability assay. VERO cells (1 × 10⁶ cells/well) were seeded onto a 96 well-plate and incubated for 24 h with NL13 peptide at different concentration (250–7.8 µM). Microscopic images (10×) were obtained for Control (a), lowest peptide concentration treated (7.8 µM) (b) and highest concentration peptide treated (250 µM) (c). d MTT assay was performed on VERO cells with NL13 peptide at different concentration (250 - 7.8 µM) where PBS served as control. Bar diagram was showed the cell viability against different concentration of peptide measured in Microplate Reader (n = 3)

