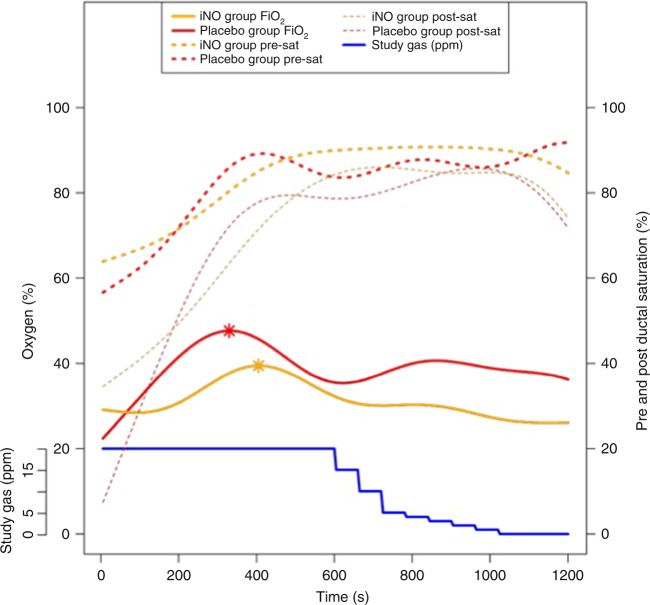
Fig. 3.
Oxygen delivery and pre- and post-ductal oxygen saturations during resuscitation. The solid lines (yellow and red) represent average oxygen administered to each group. The interrupted lines (yellow and red) represent pre-ductal (thick) and post-ductal (thin) oxygen saturations in each group. The asterisks represent the highest average oxygen concentration in each group. The blue line represents study gas (ppm)

