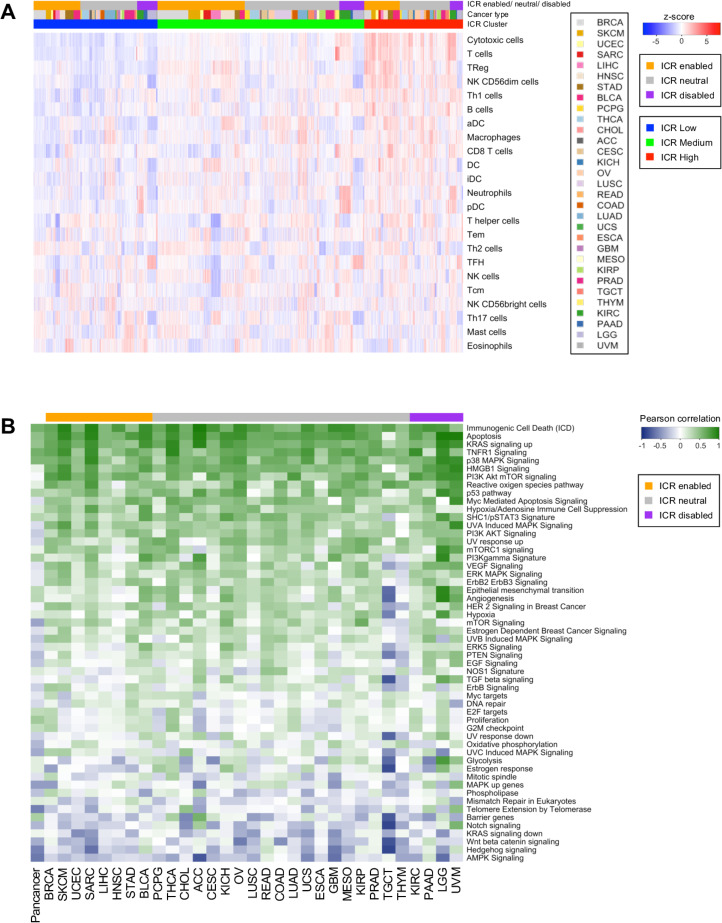
Figure 2.
Deconvolution of immune cell populations and enrichment of oncogenic pathways through single sample GSEA. (A) Heatmap of enrichment values for cell-specific immune-signatures as described by Bindea et al.13 Samples are ordered by ICR cluster and ordered by cancer type within ICR clusters. (B) Pearson coefficient of correlation between ICR score and enrichment scores of oncogenic pathways per cancer. pathways that have a positive correlation with ICR are green and those with an inverse correlation are blue. GSEA, gene set enrichment analysis; ICR, immunologic constant of rejection.

