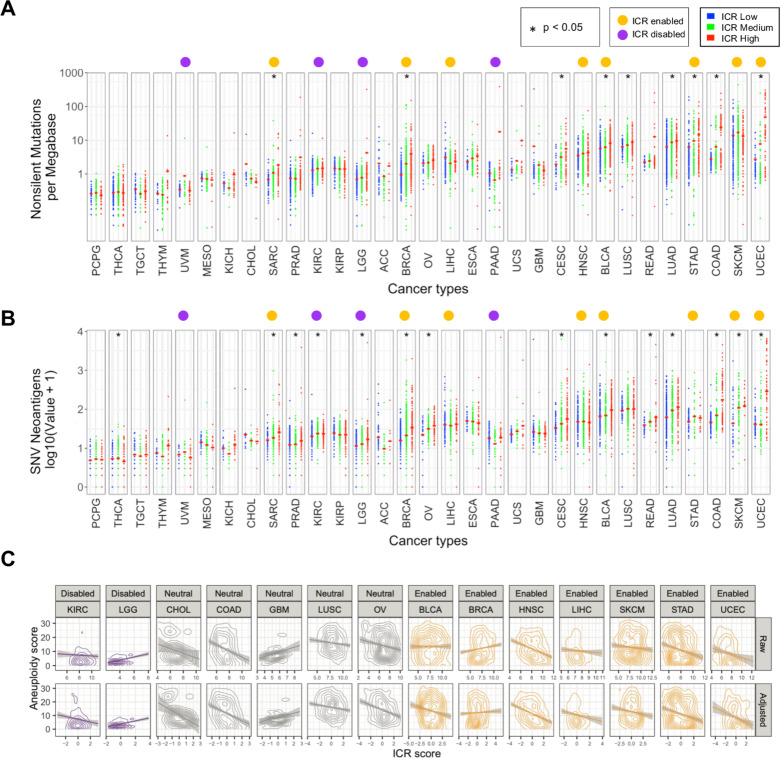
Figure 3.
Association of ICR with nonsilent mutation rate, predicted neoantigen load, and tumor aneuploidy. (A) Scatter plot of log transformed non-silent mutation count per ICR cluster for each cancer type. (B) Log transformed predicated neoantigen load per ICR cluster for each cancer type. (A, B) Red cross-bar represents the mean value per ICR cluster. Cancer types are ordered by mean nonsilent mutation count per cancer. Non-silent mutation rate and predicted neoantigen load were obtained from Thorsson et al.7 (C) Correlation between aneuploidy score and raw/purity adjusted ICR score for all cohorts with significant relationships between ICR and aneuploidy. ICR, immunological constant of rejection.

