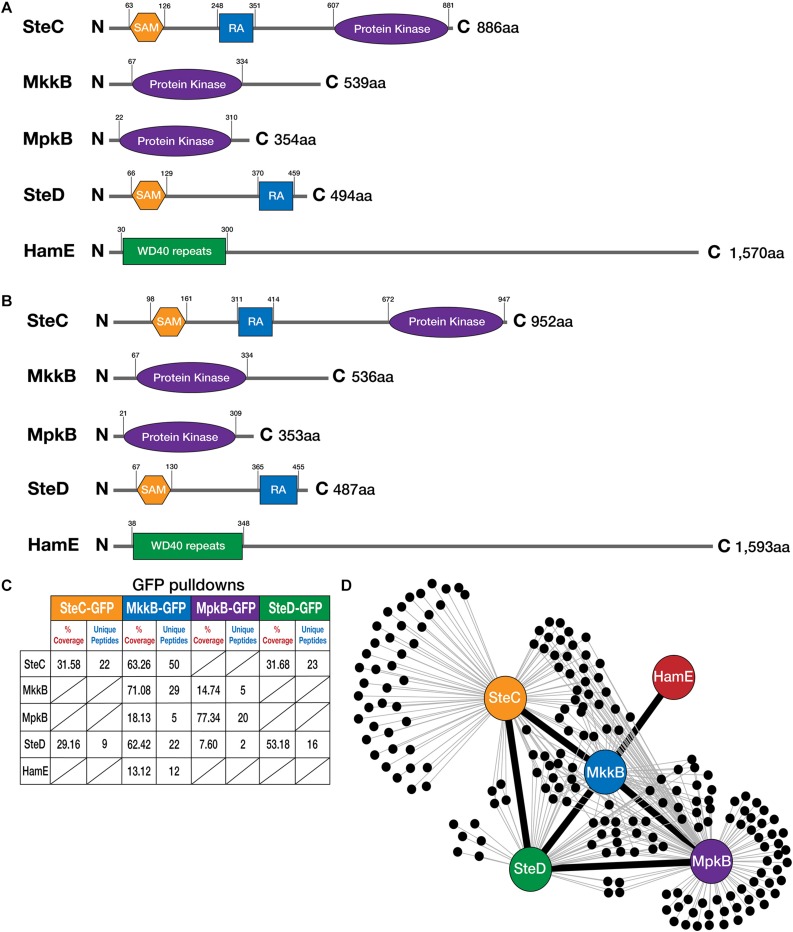
FIGURE 1.
Detection of interactions between pheromone module proteins in A. fumigatus. (A) Schematic diagrams illustrating the structures of the pheromone module proteins in A. nidulans. Amino acids (aa). N (N-terminal), C (C-terminal). SAM (Sterile Alpha Motif), RA (Ras-associated). Detection of protein sizes and domains were performed using a combination of ScanProsite (de Castro et al., 2006) and InterPro software (Mitchell et al., 2019). (B) Schematics illustrating the structures of the pheromone module proteins in A. fumigatus. Reciprocal BLAST searches were performed to detect protein homologs (Altschul et al., 1990). (C) GFP-pulldowns and LC-MS/MS analysis of the pheromone module kinases and SteD. GFP-tagged proteins are given at the top of the table and co-purified proteins are given on the left-hand side. The percentage of coverage and unique peptides of each detected protein are displayed. Two biological replicates of each strain were used. Strains were cultured vegetatively for 24 h in complete media. (D) Interaction network of the pheromone module components based on unique peptides detected in each GFP pulldown. Each black dot represents a protein detected in two independent biological replicates but not in the wild type.

