
Figure 2.
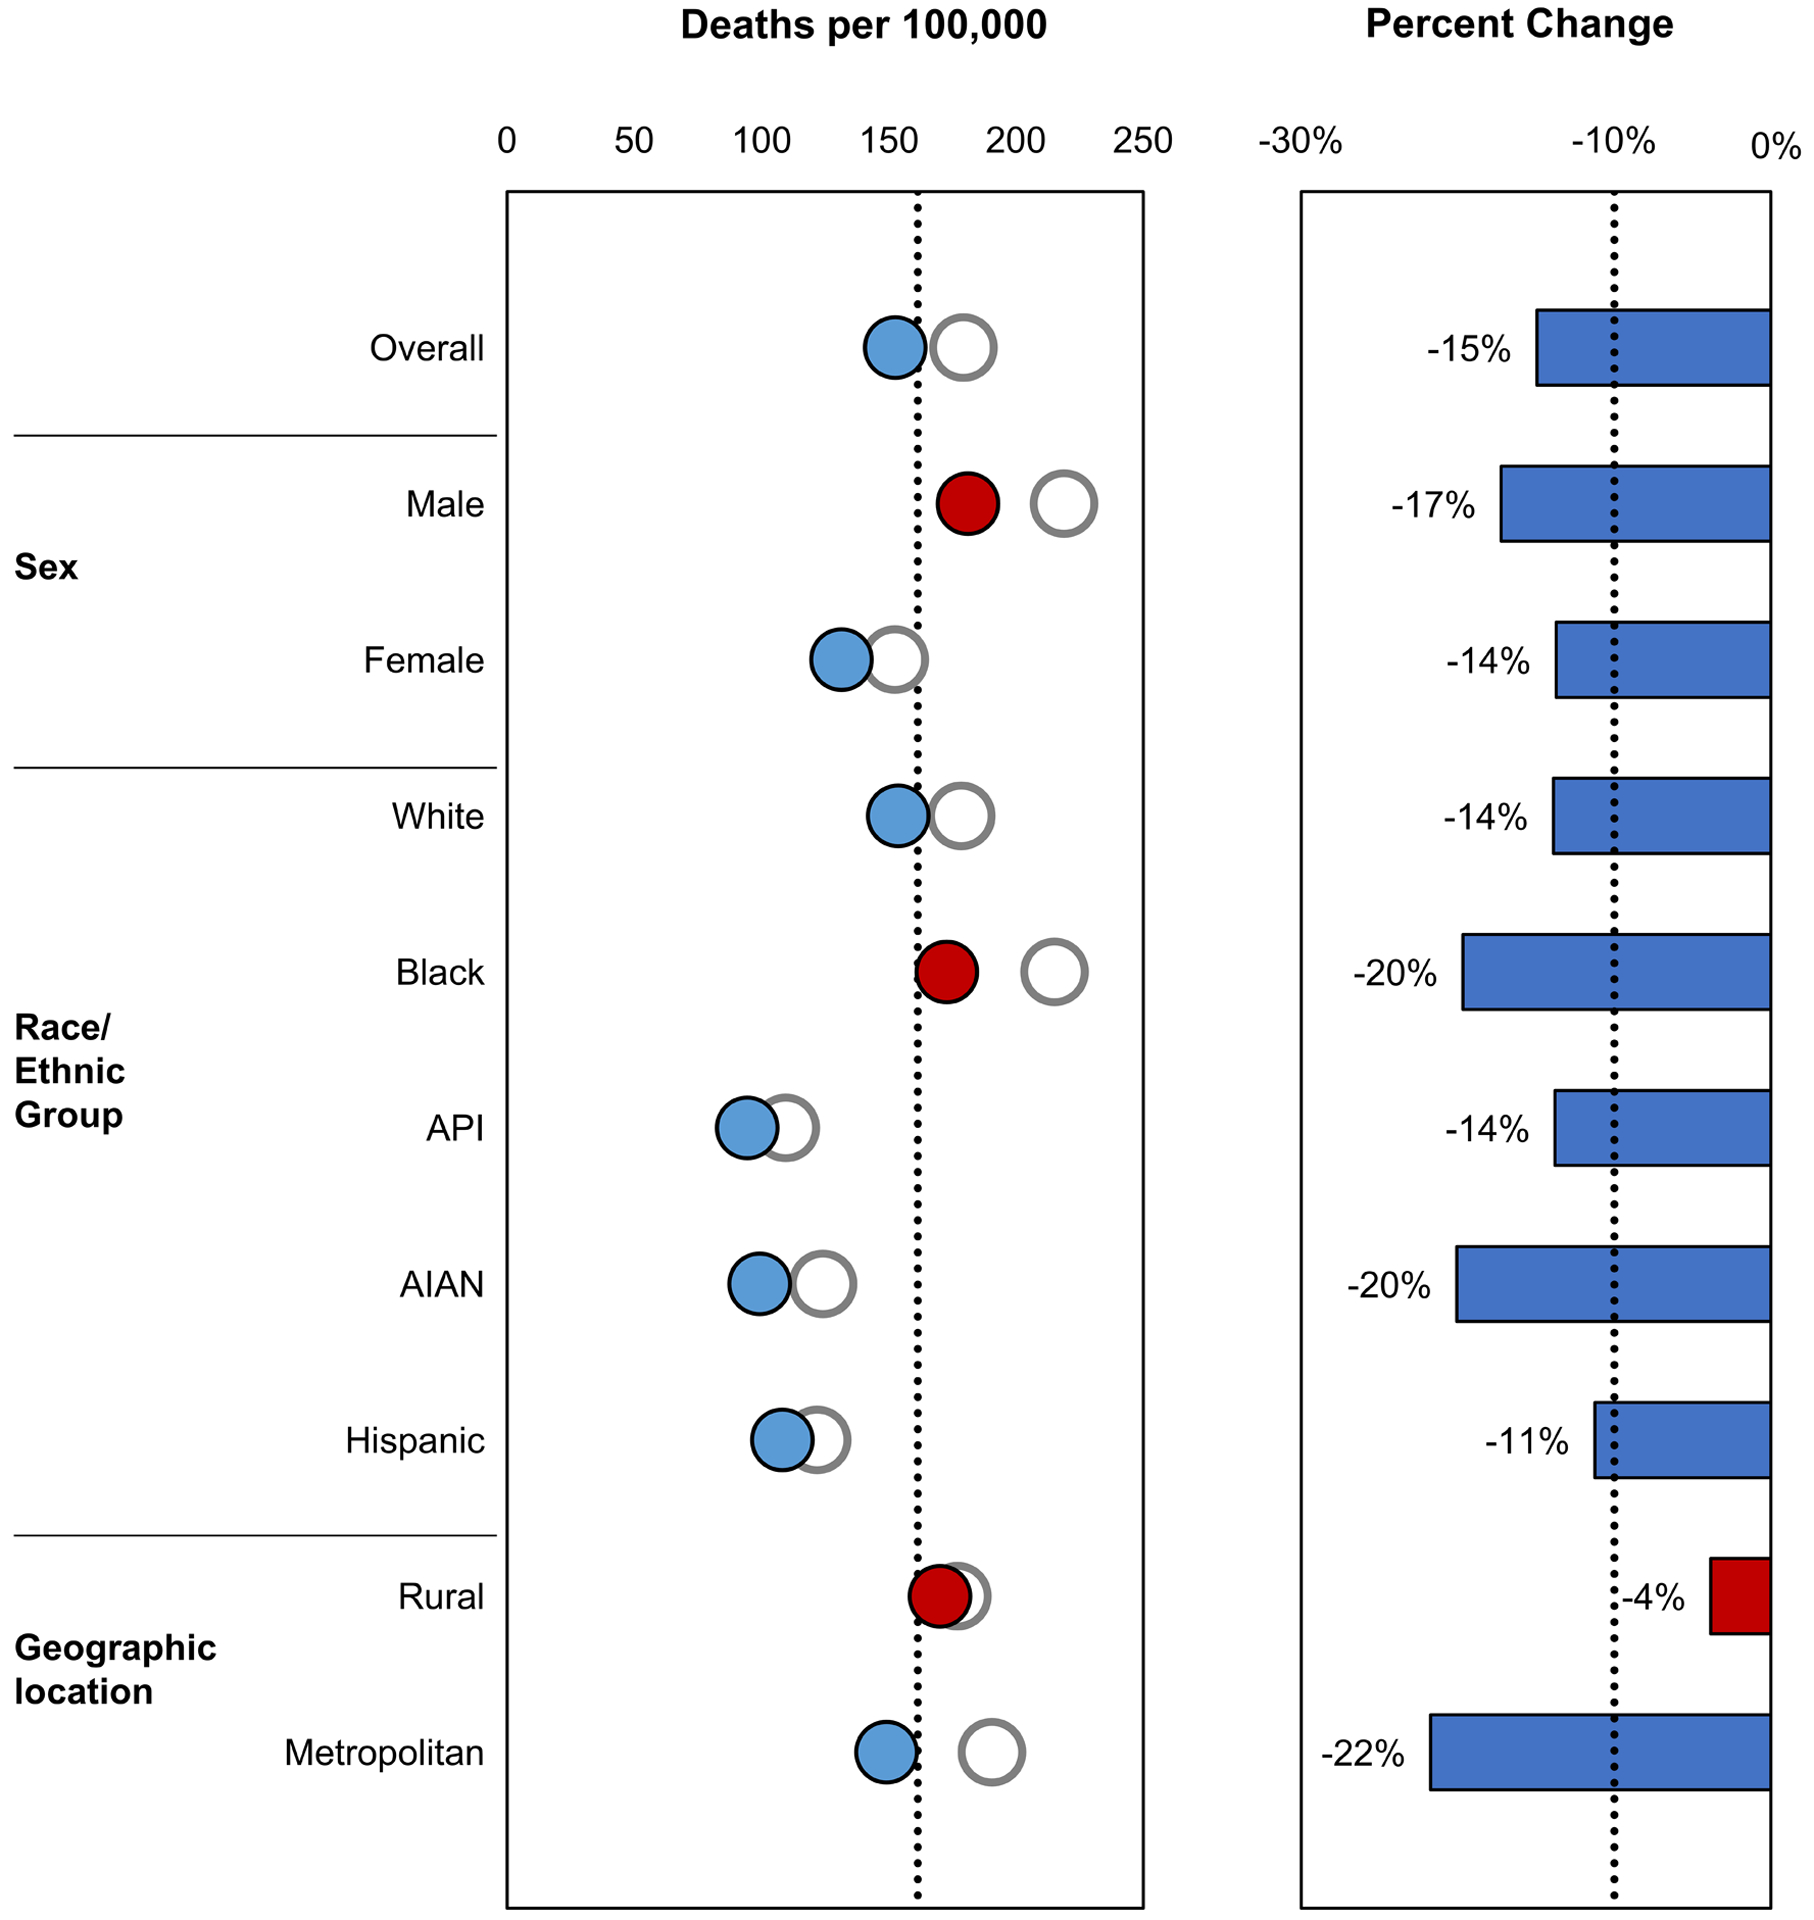
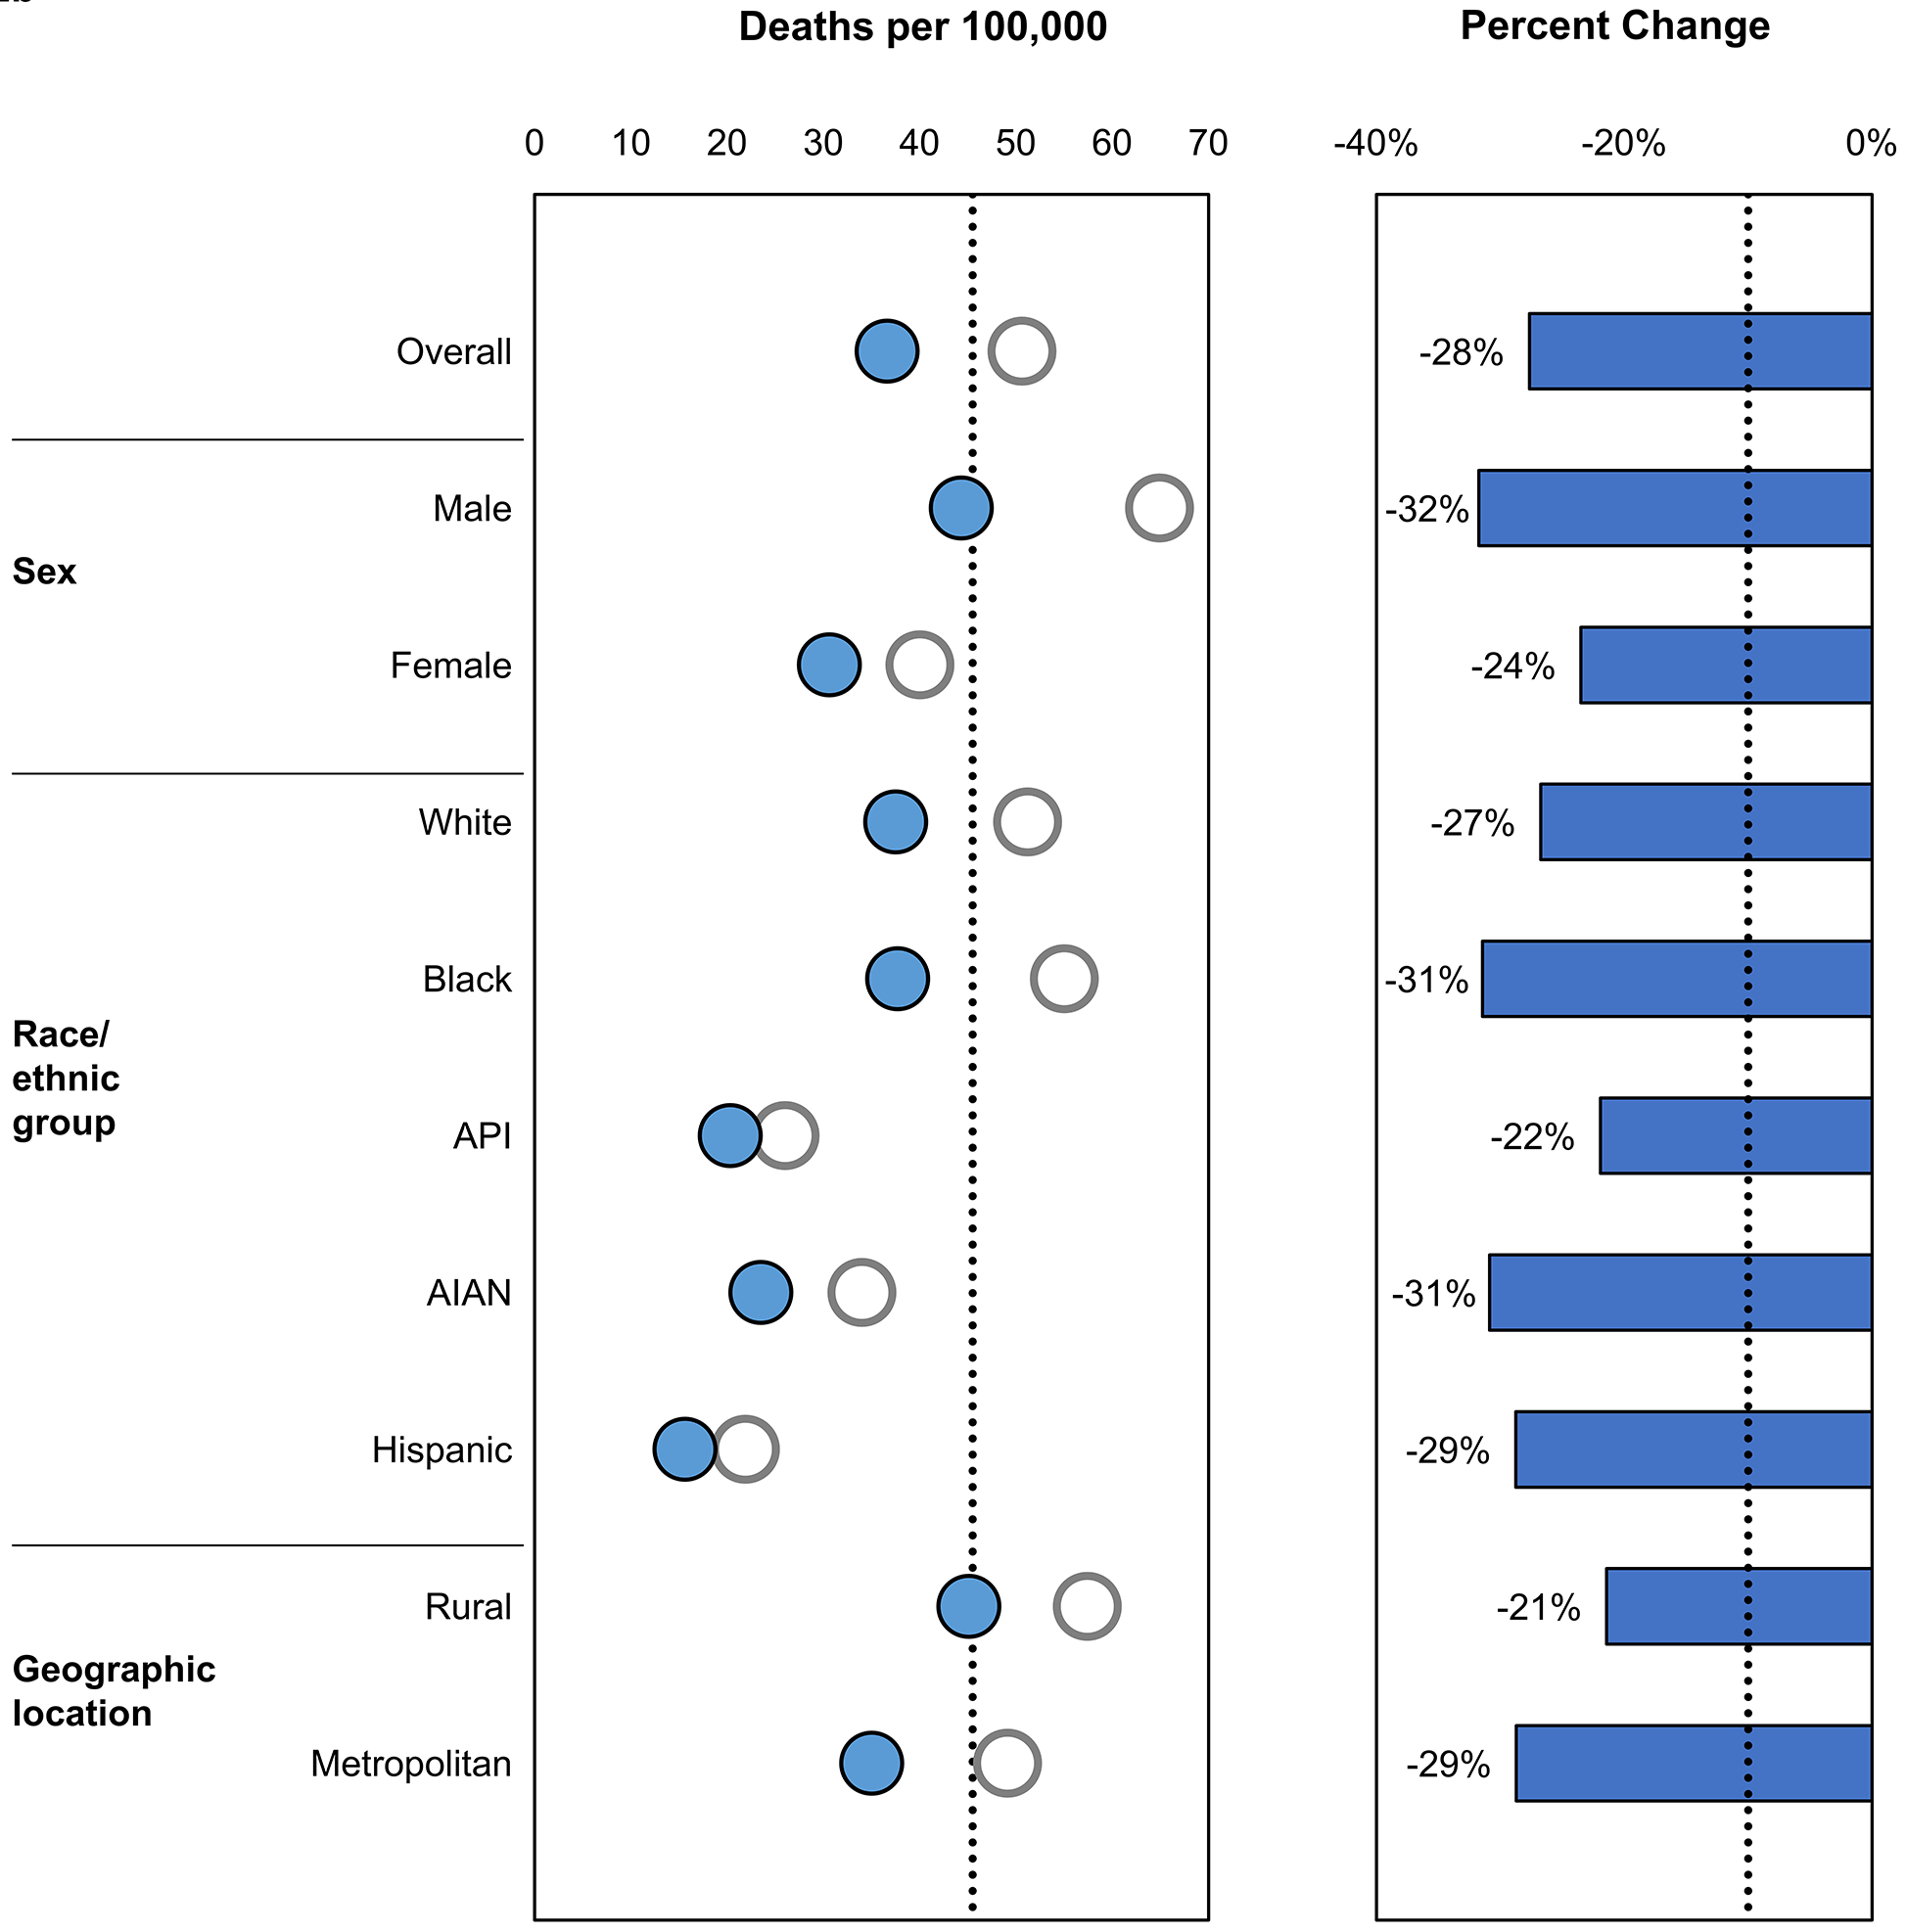
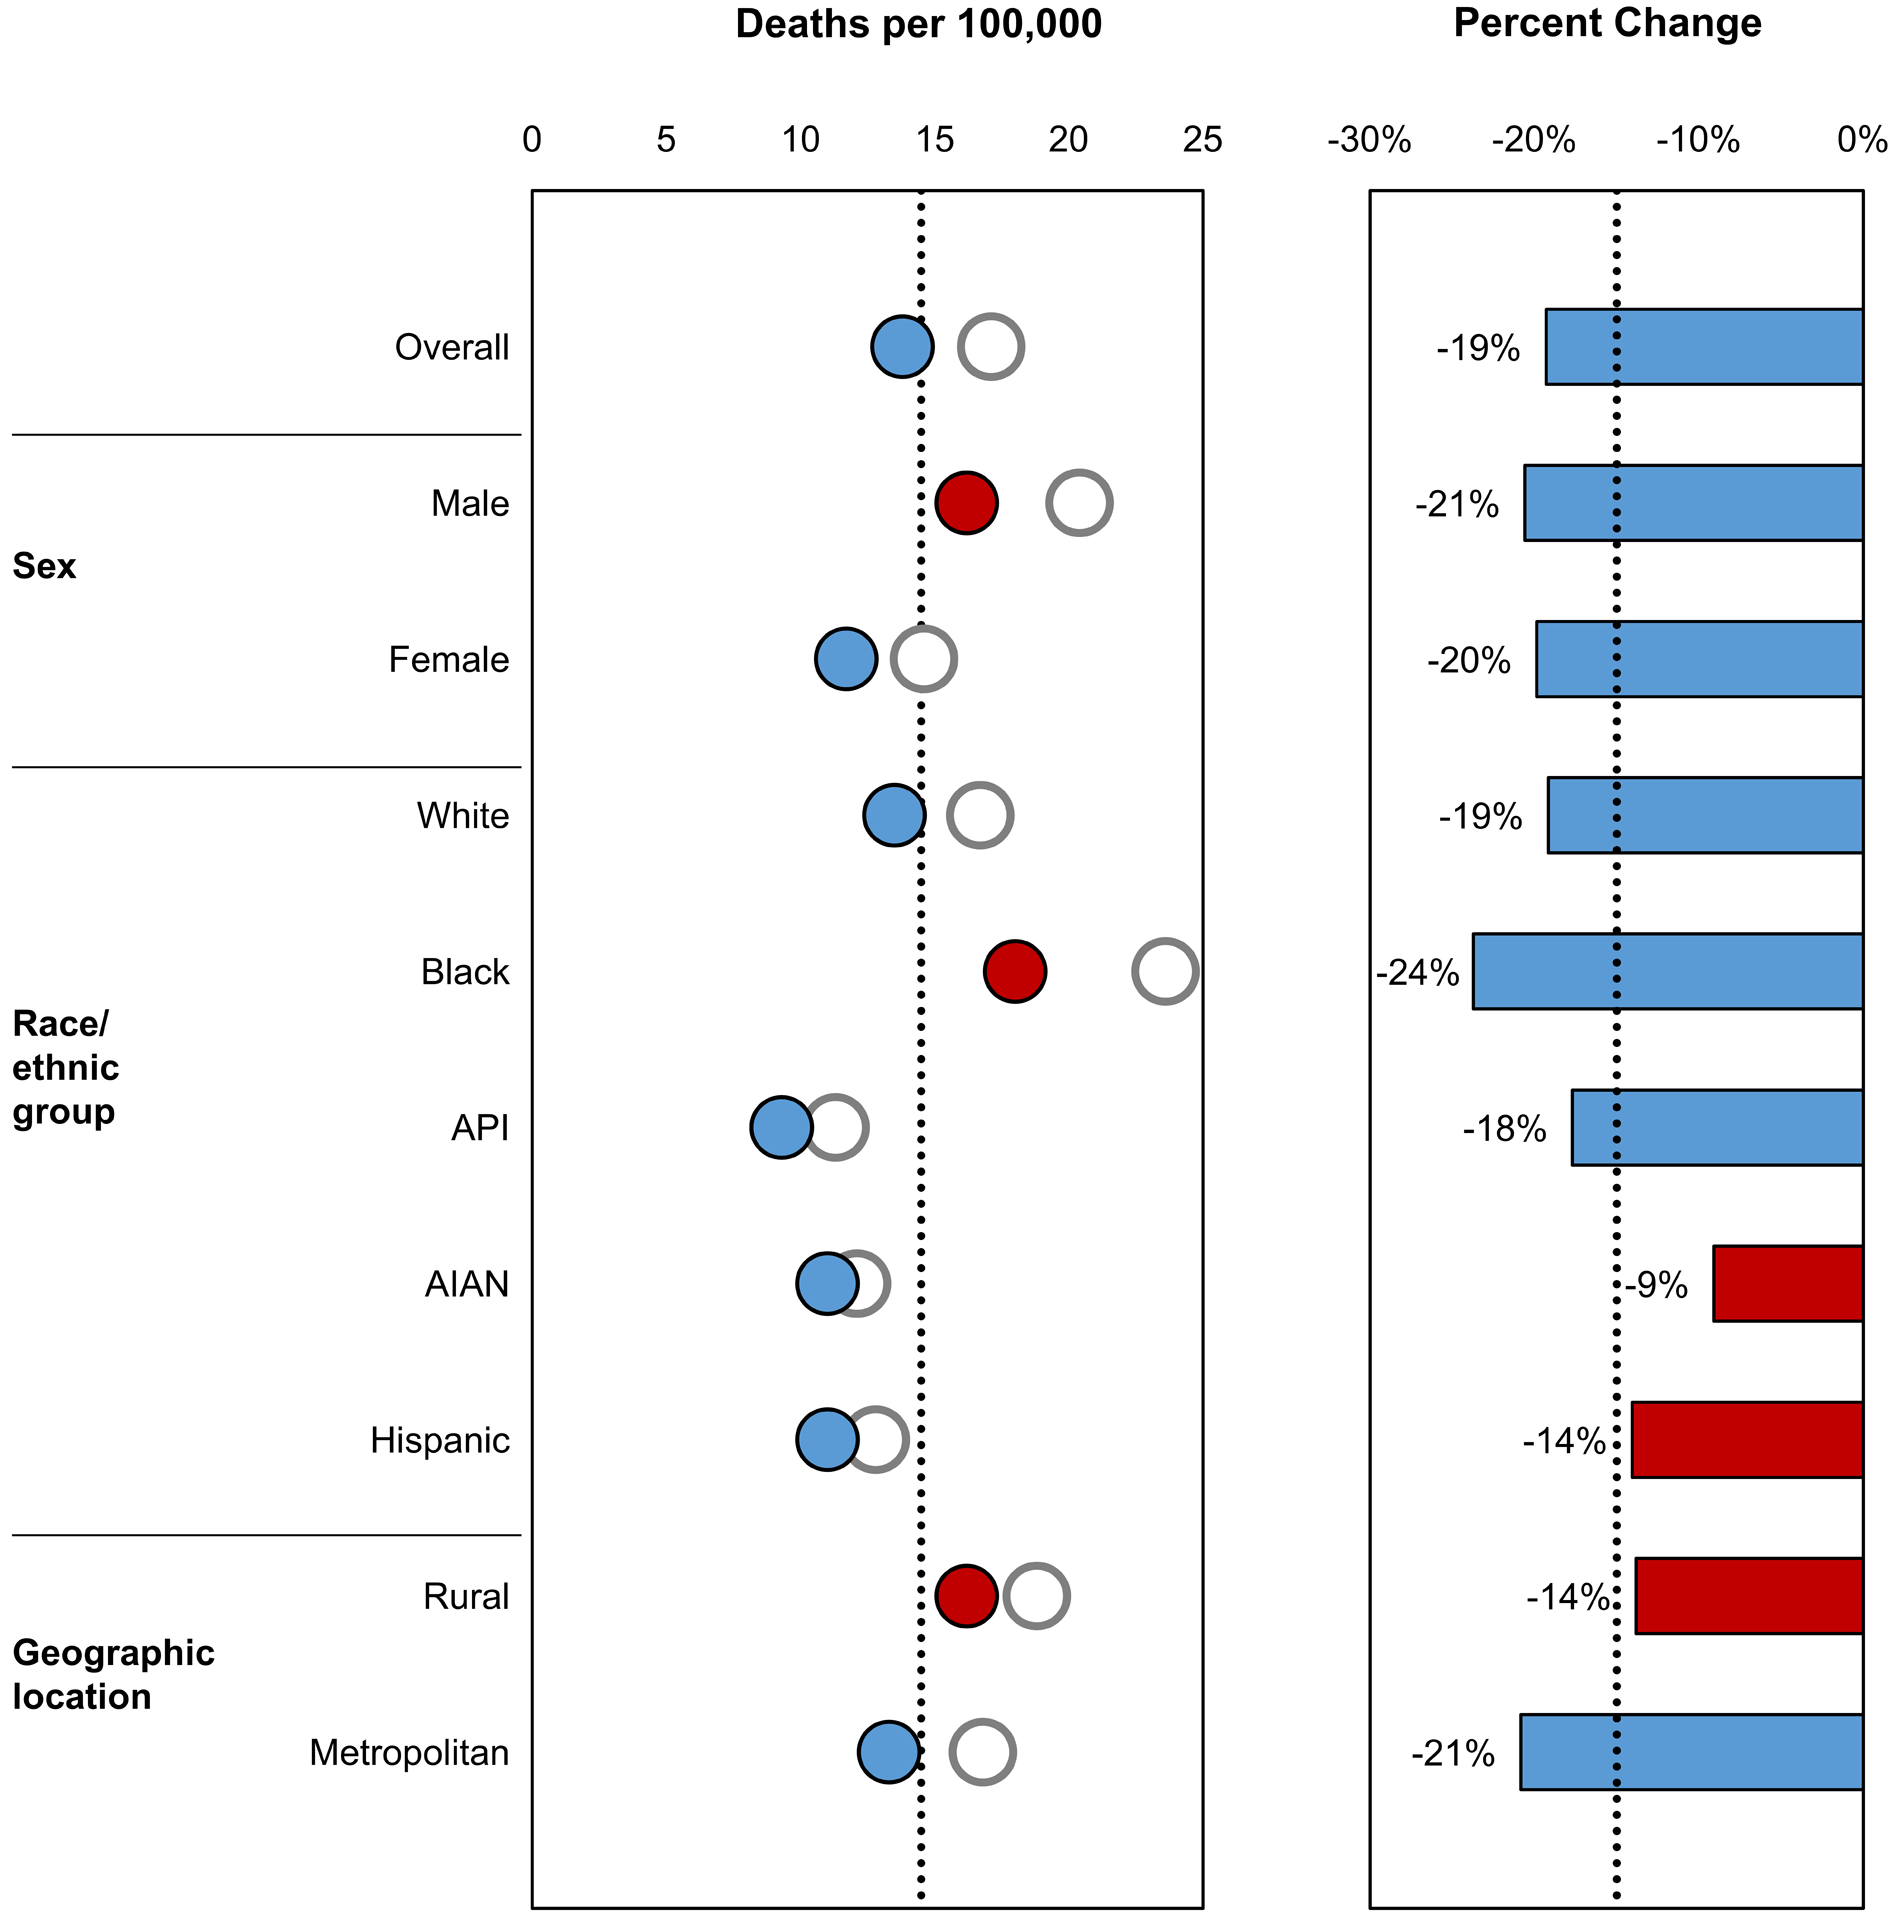
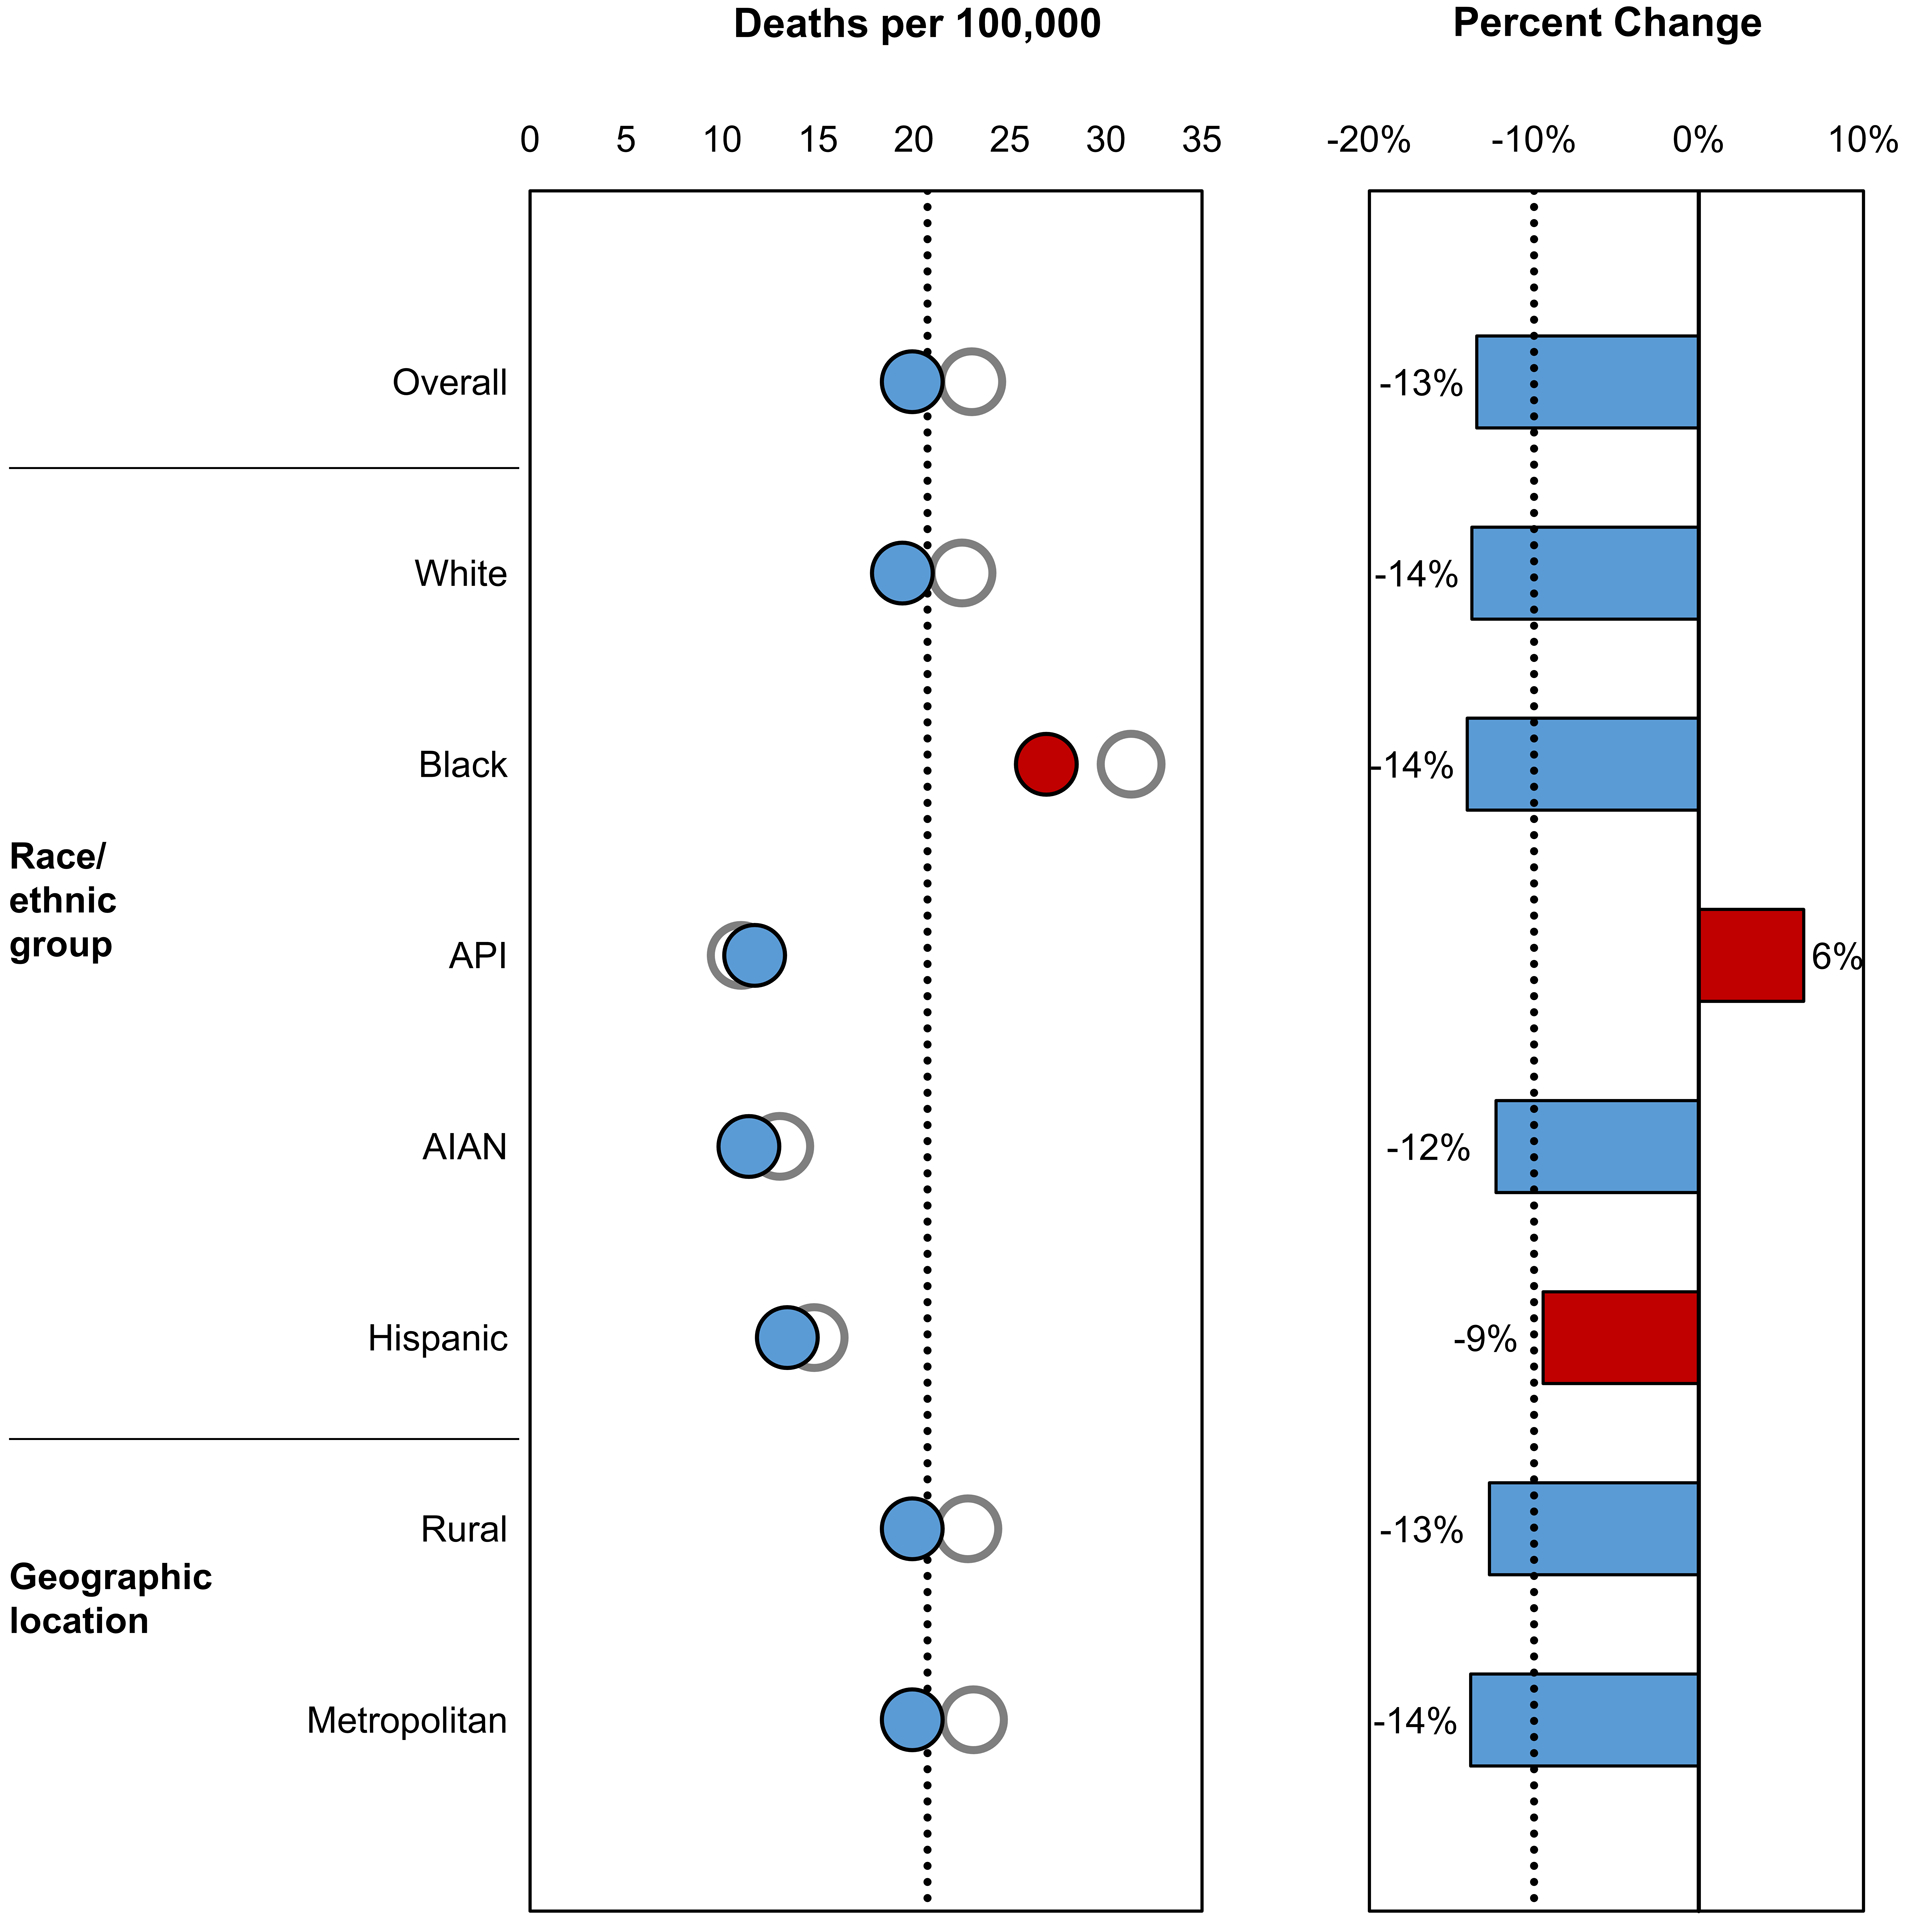
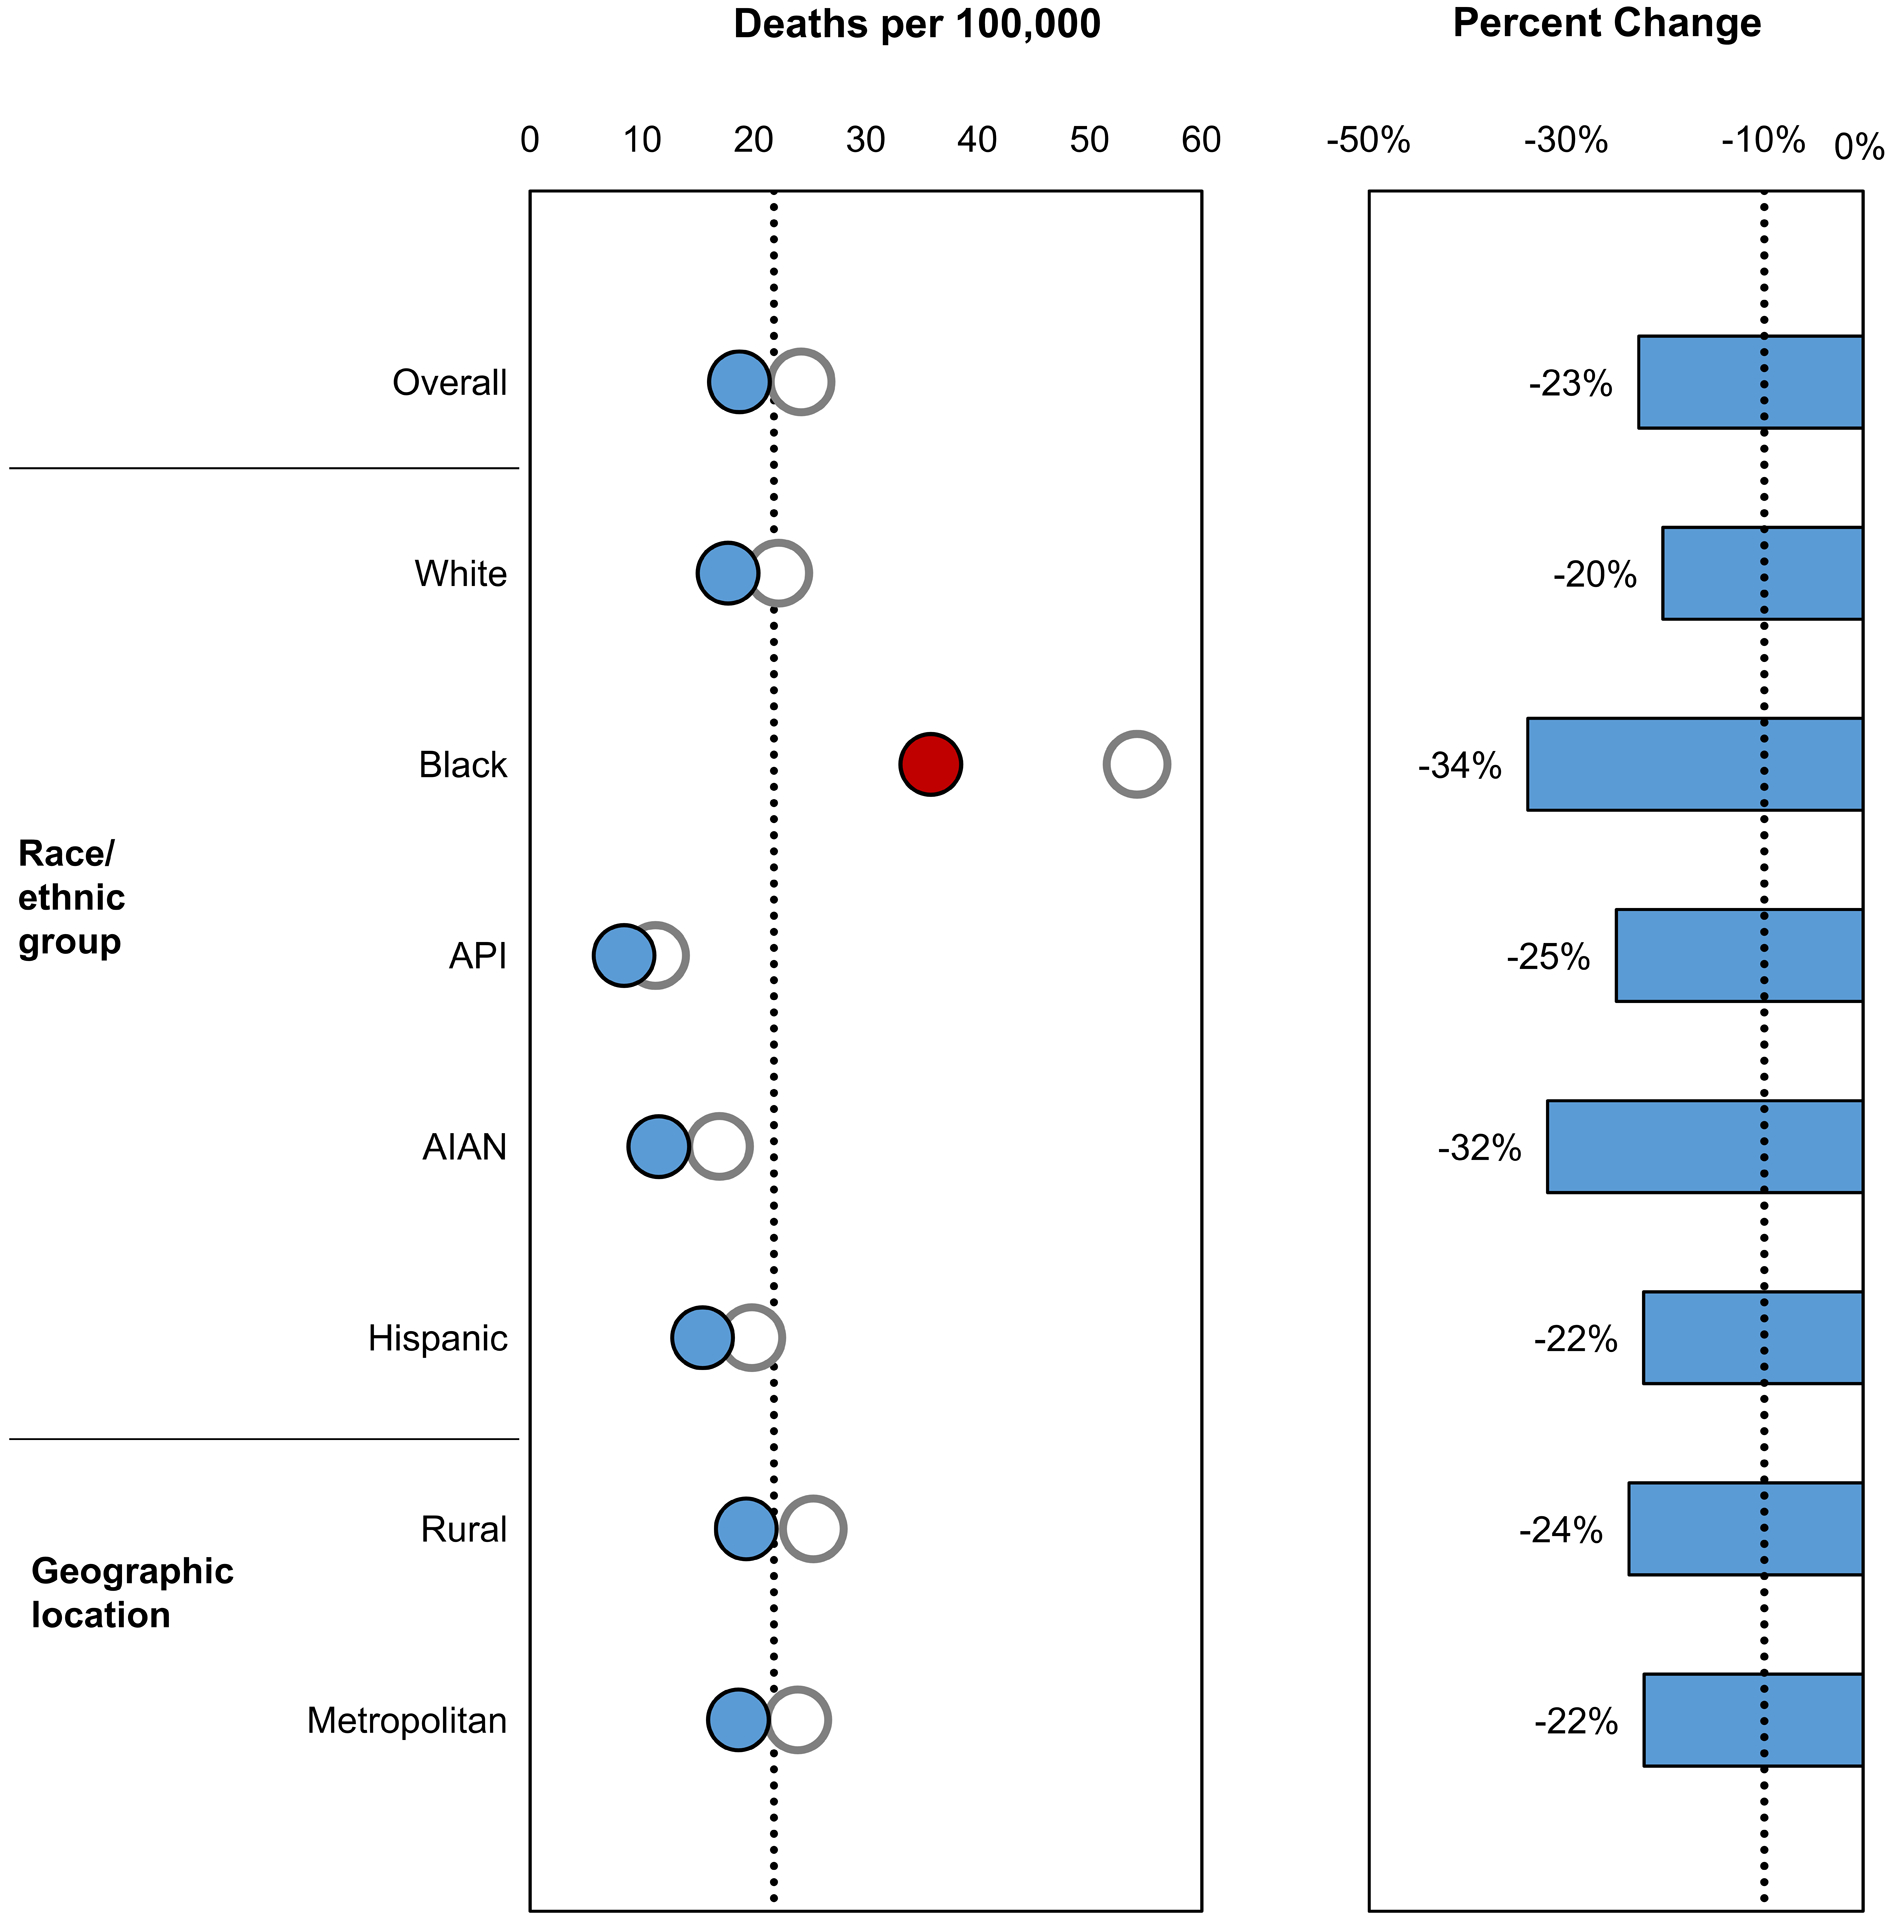
Healthy People 2020 objectives related to cancer death rates are illustrated. Data are from the National Vital Statistics System, baseline values are from 2007, and the most recent estimates are from 2017. Healthy People 2020 targets are indicated by black dotted lines. The baseline value is indicated as a white circle, and the most recent estimate is indicated as a blue circle if the target was met and as a red circle if the target was not met. The percentage change from the baseline value to the most recent estimate is indicated as a blue bar if the percentage improvement target was met and as a red bar if the percentage improvement target was not met. The Healthy People 2020 targets are: (A) reduce overall cancer deaths per 100,000 population from 179.3 in 2007 to 161.4 in 2020, a 10% improvement; (B) reduce lung cancer deaths per 100,000 population from 50.6 in 2007 to 45.5 in 2020, a 10% improvement; (C) reduce colorectal cancer deaths per 100,000 population from 17.1 in 2007 to 14.5 in 2020, a 15% improvement; (D) reduce female breast cancer deaths per 100,000 female population from 23.0 in 2007 to 20.7 in 2020, a 10% improvement; and (E) reduce prostate cancer deaths per 100,000 male population from 24.2 in 2007 to 21.8 in 2020, a 10% improvement. AIAN indicates American Indian/Alaska Native; API, Asian or Pacific Islander.