Figure 4.
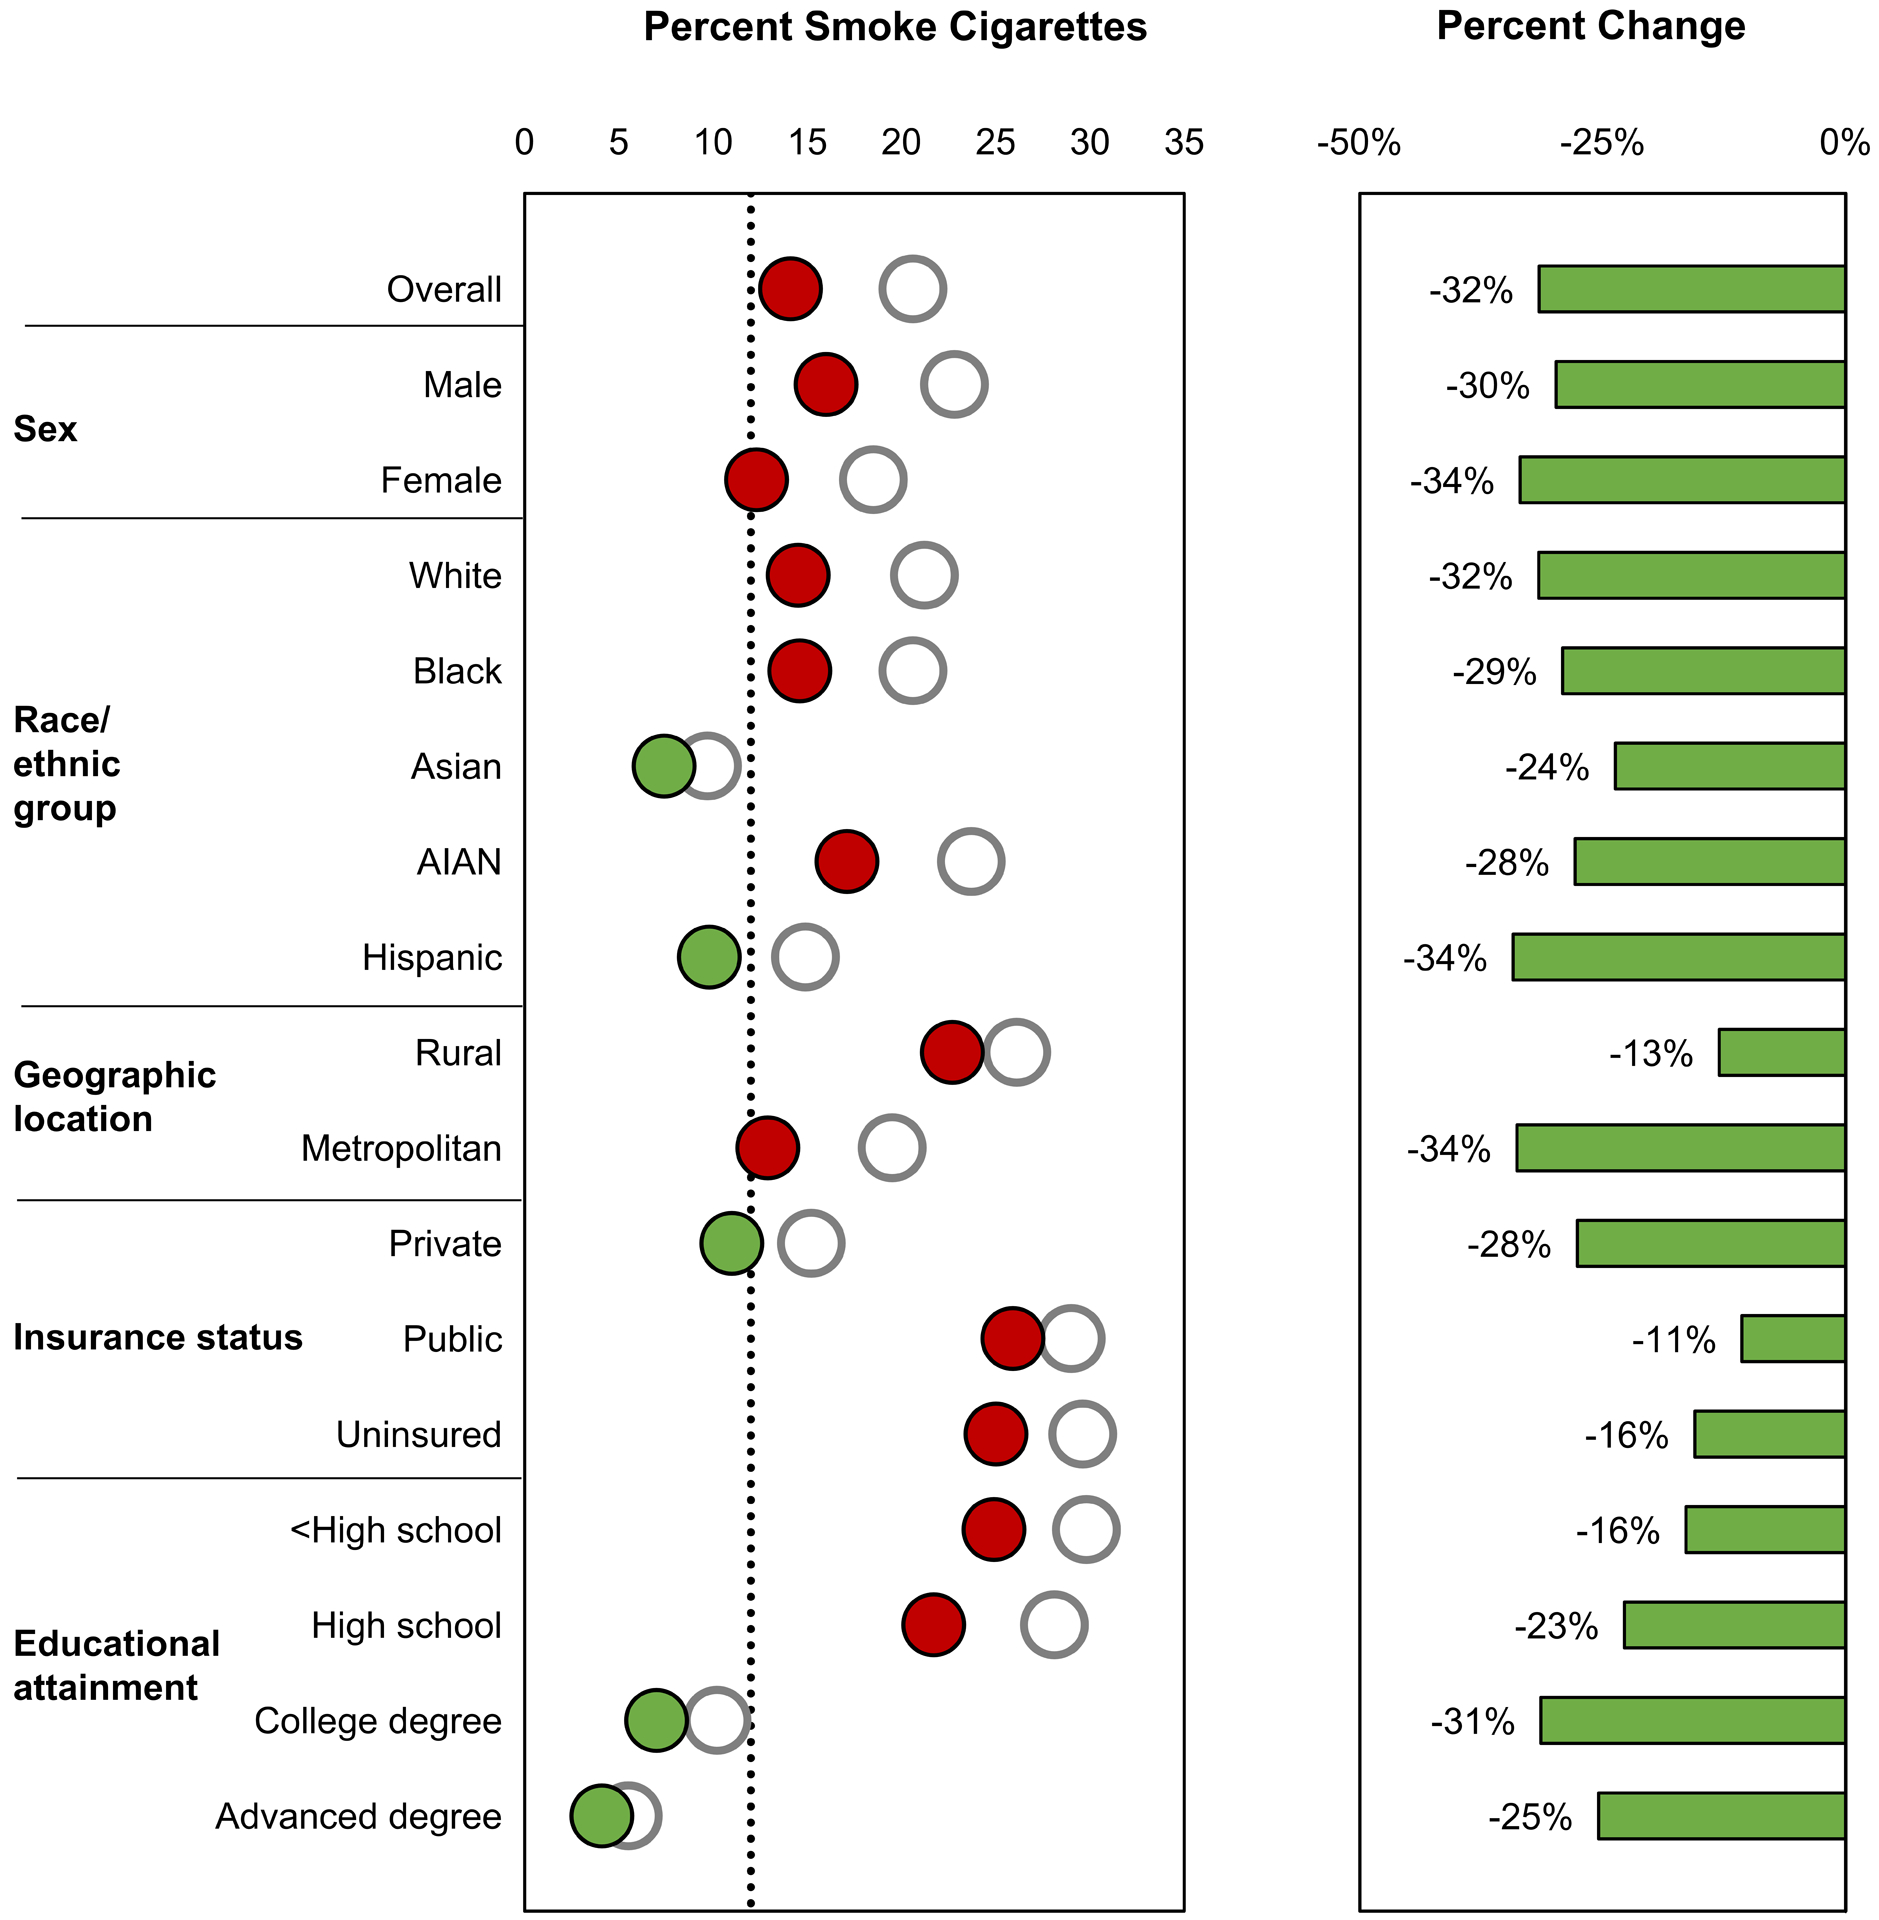
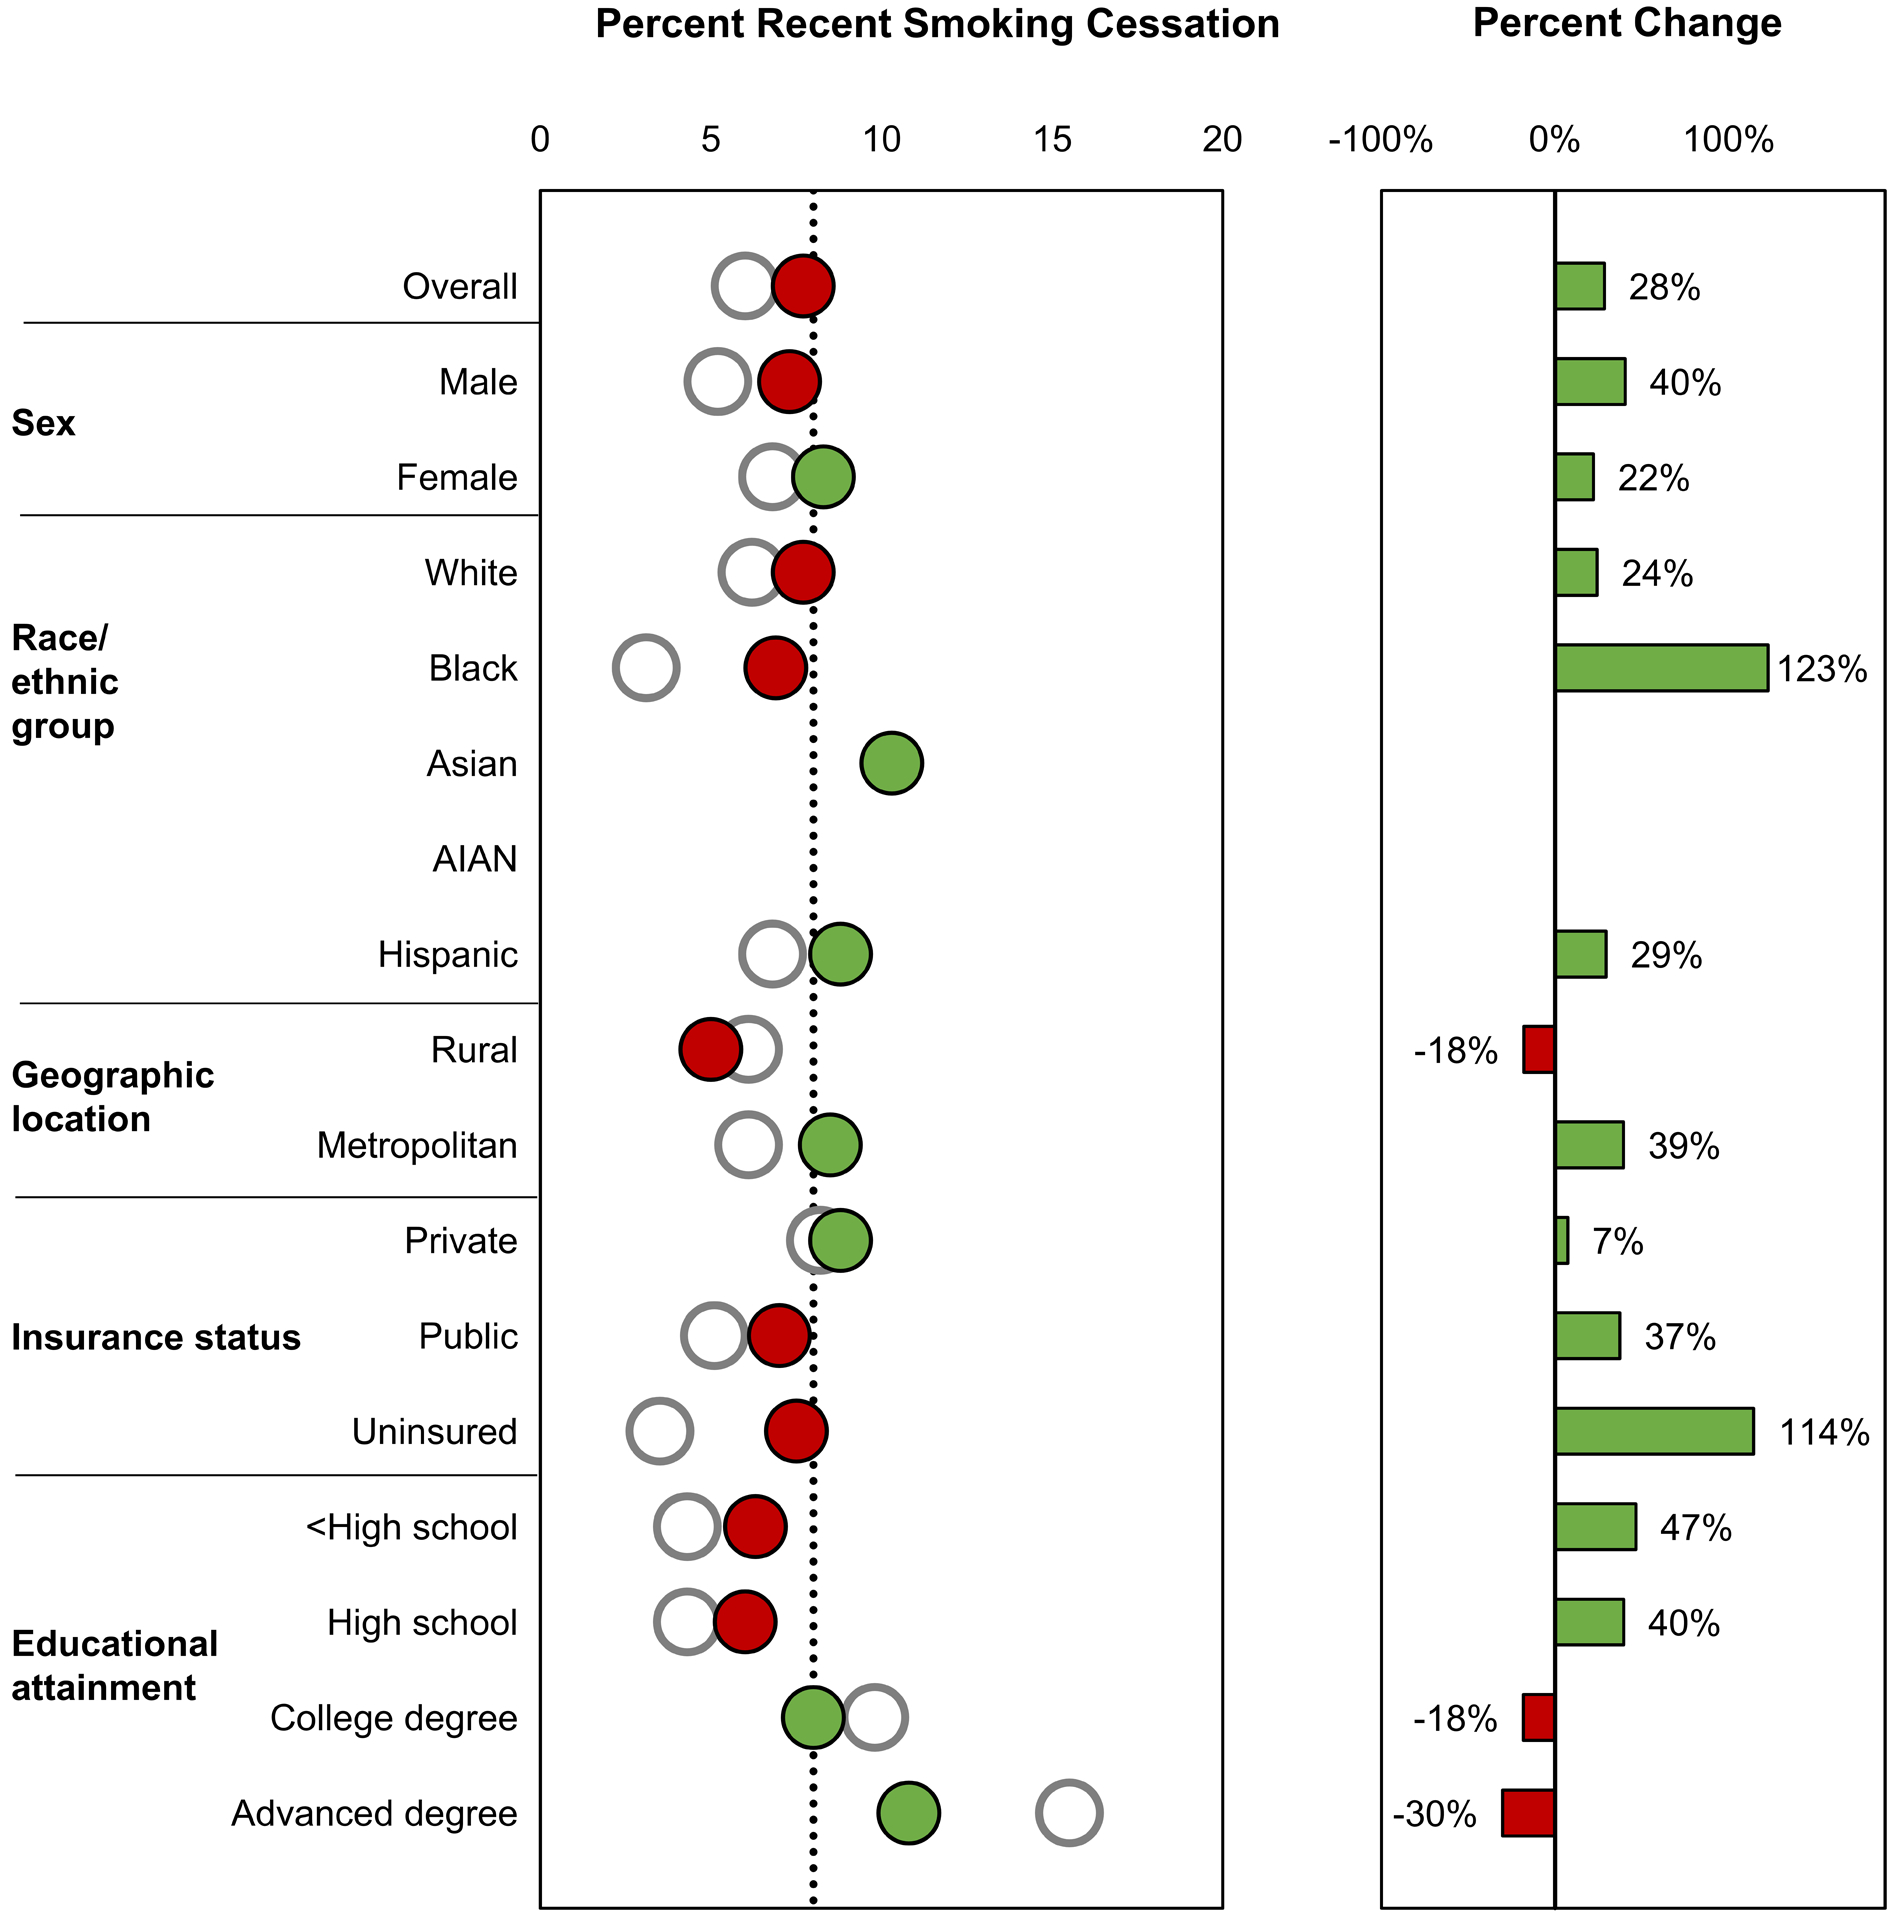
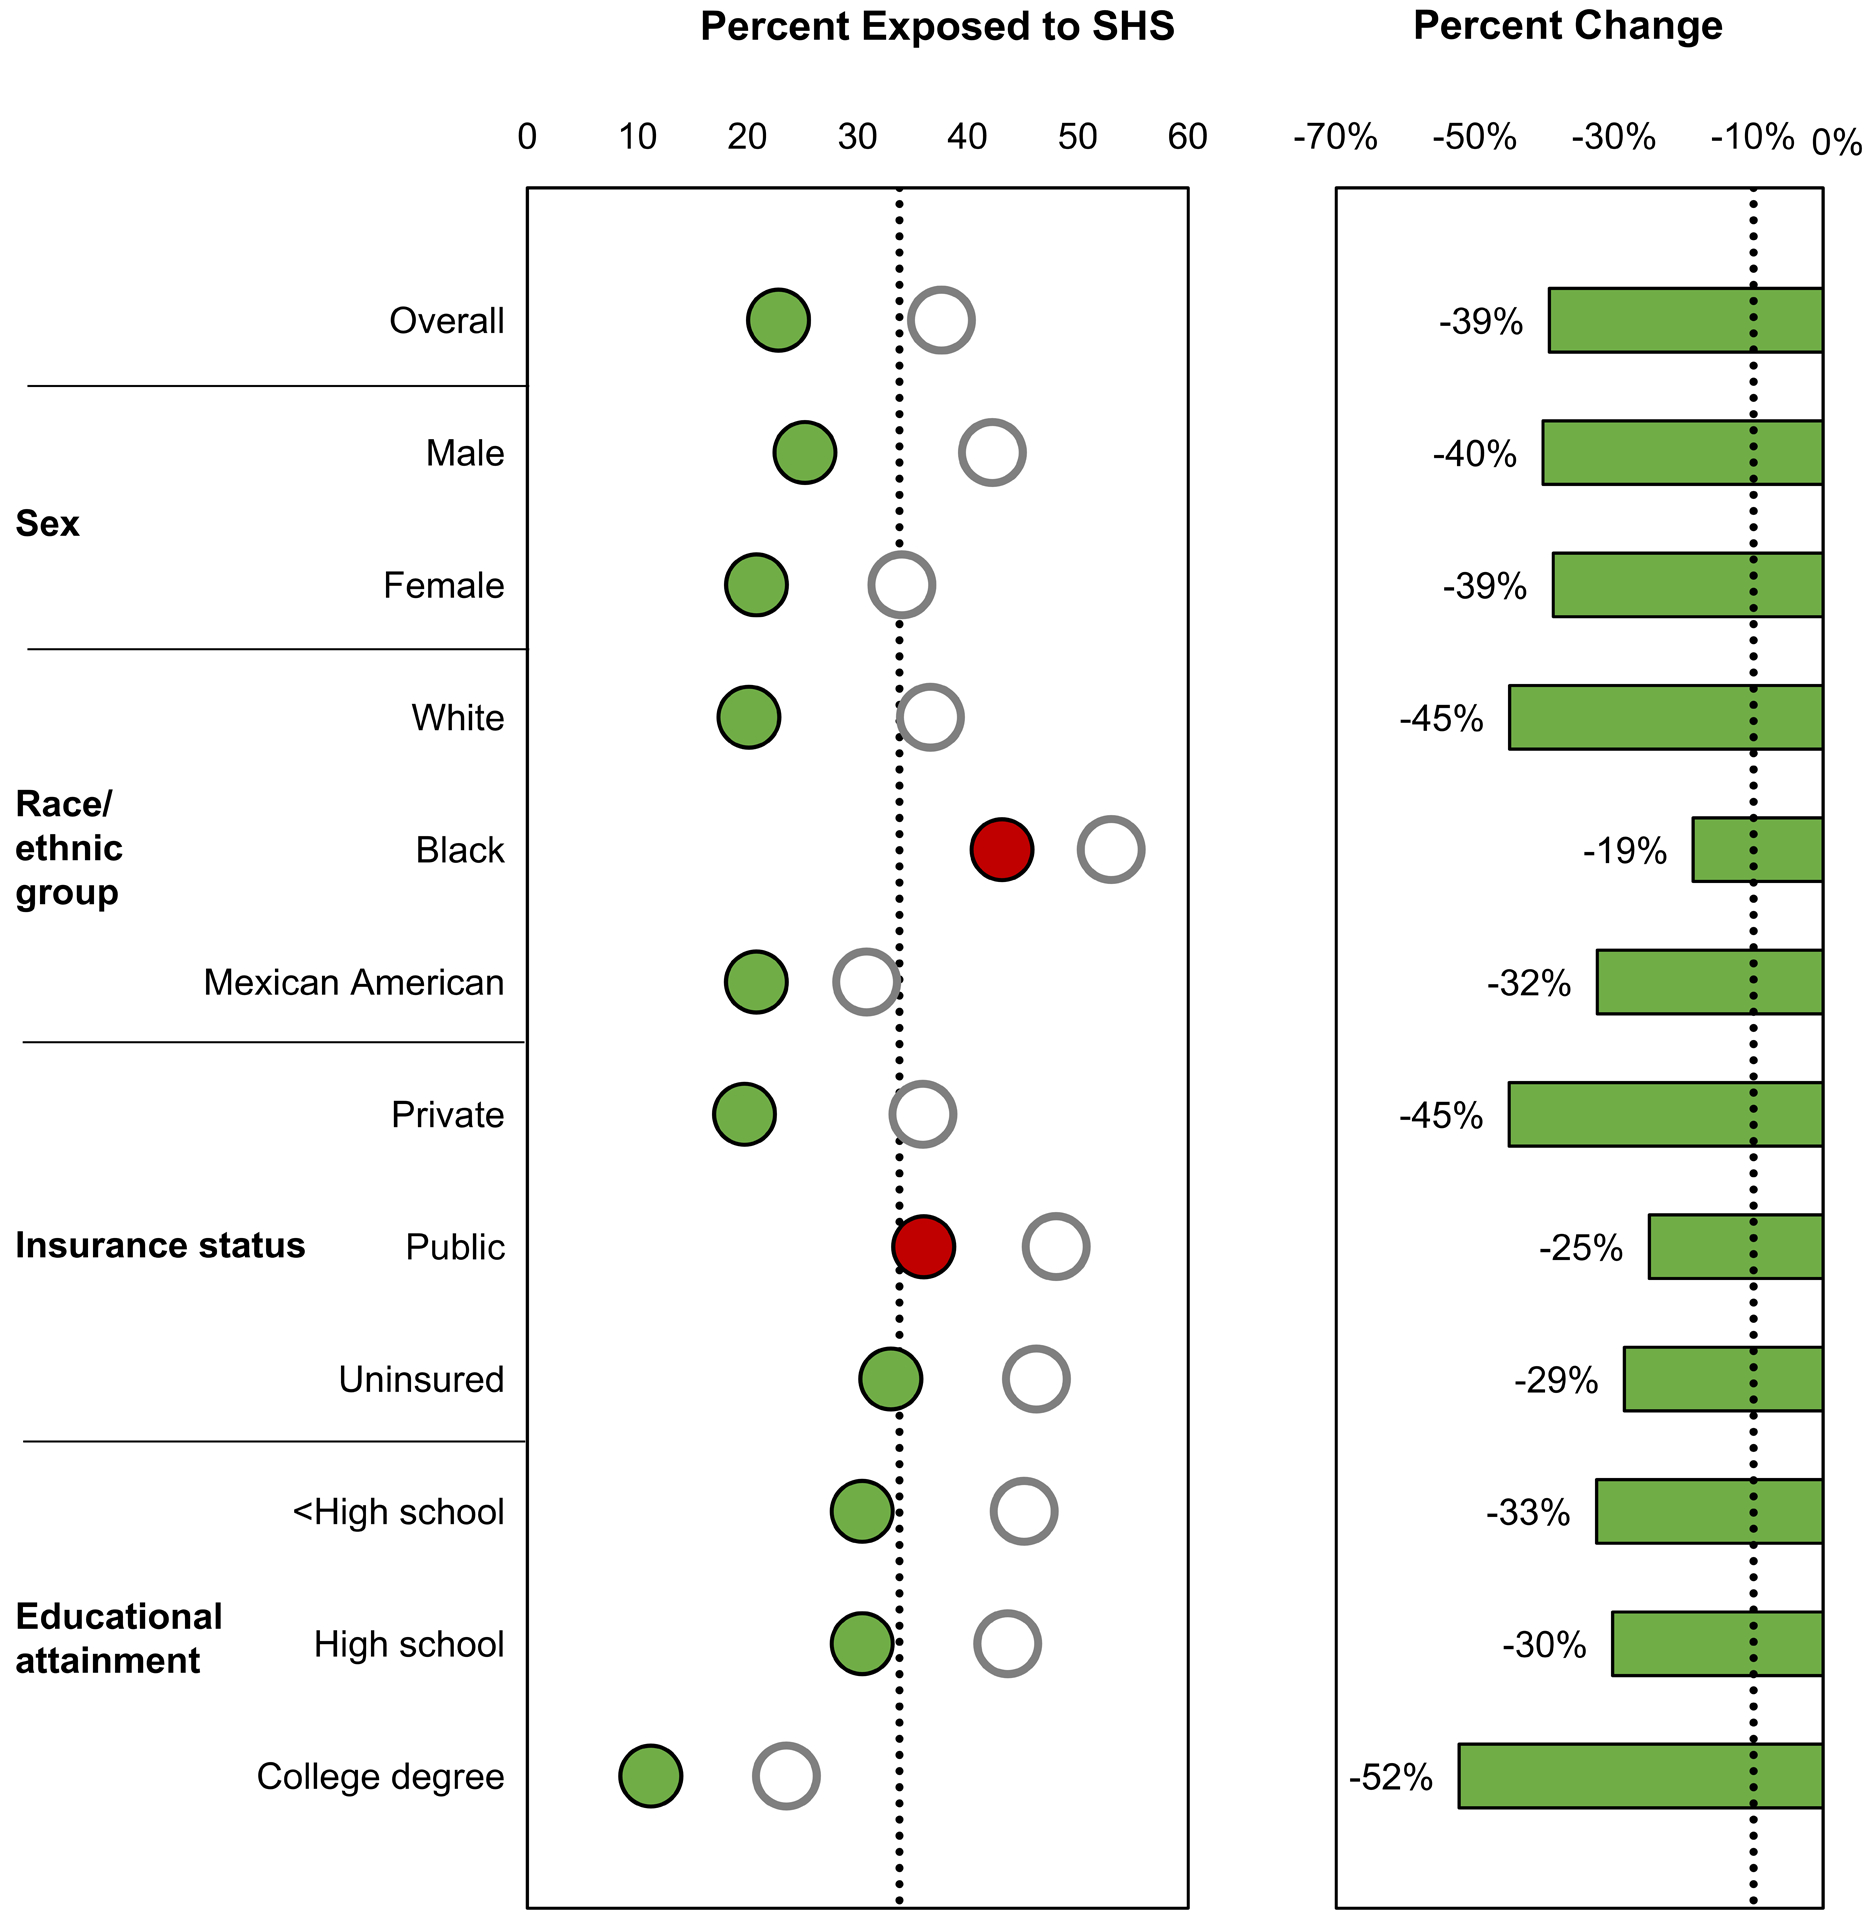
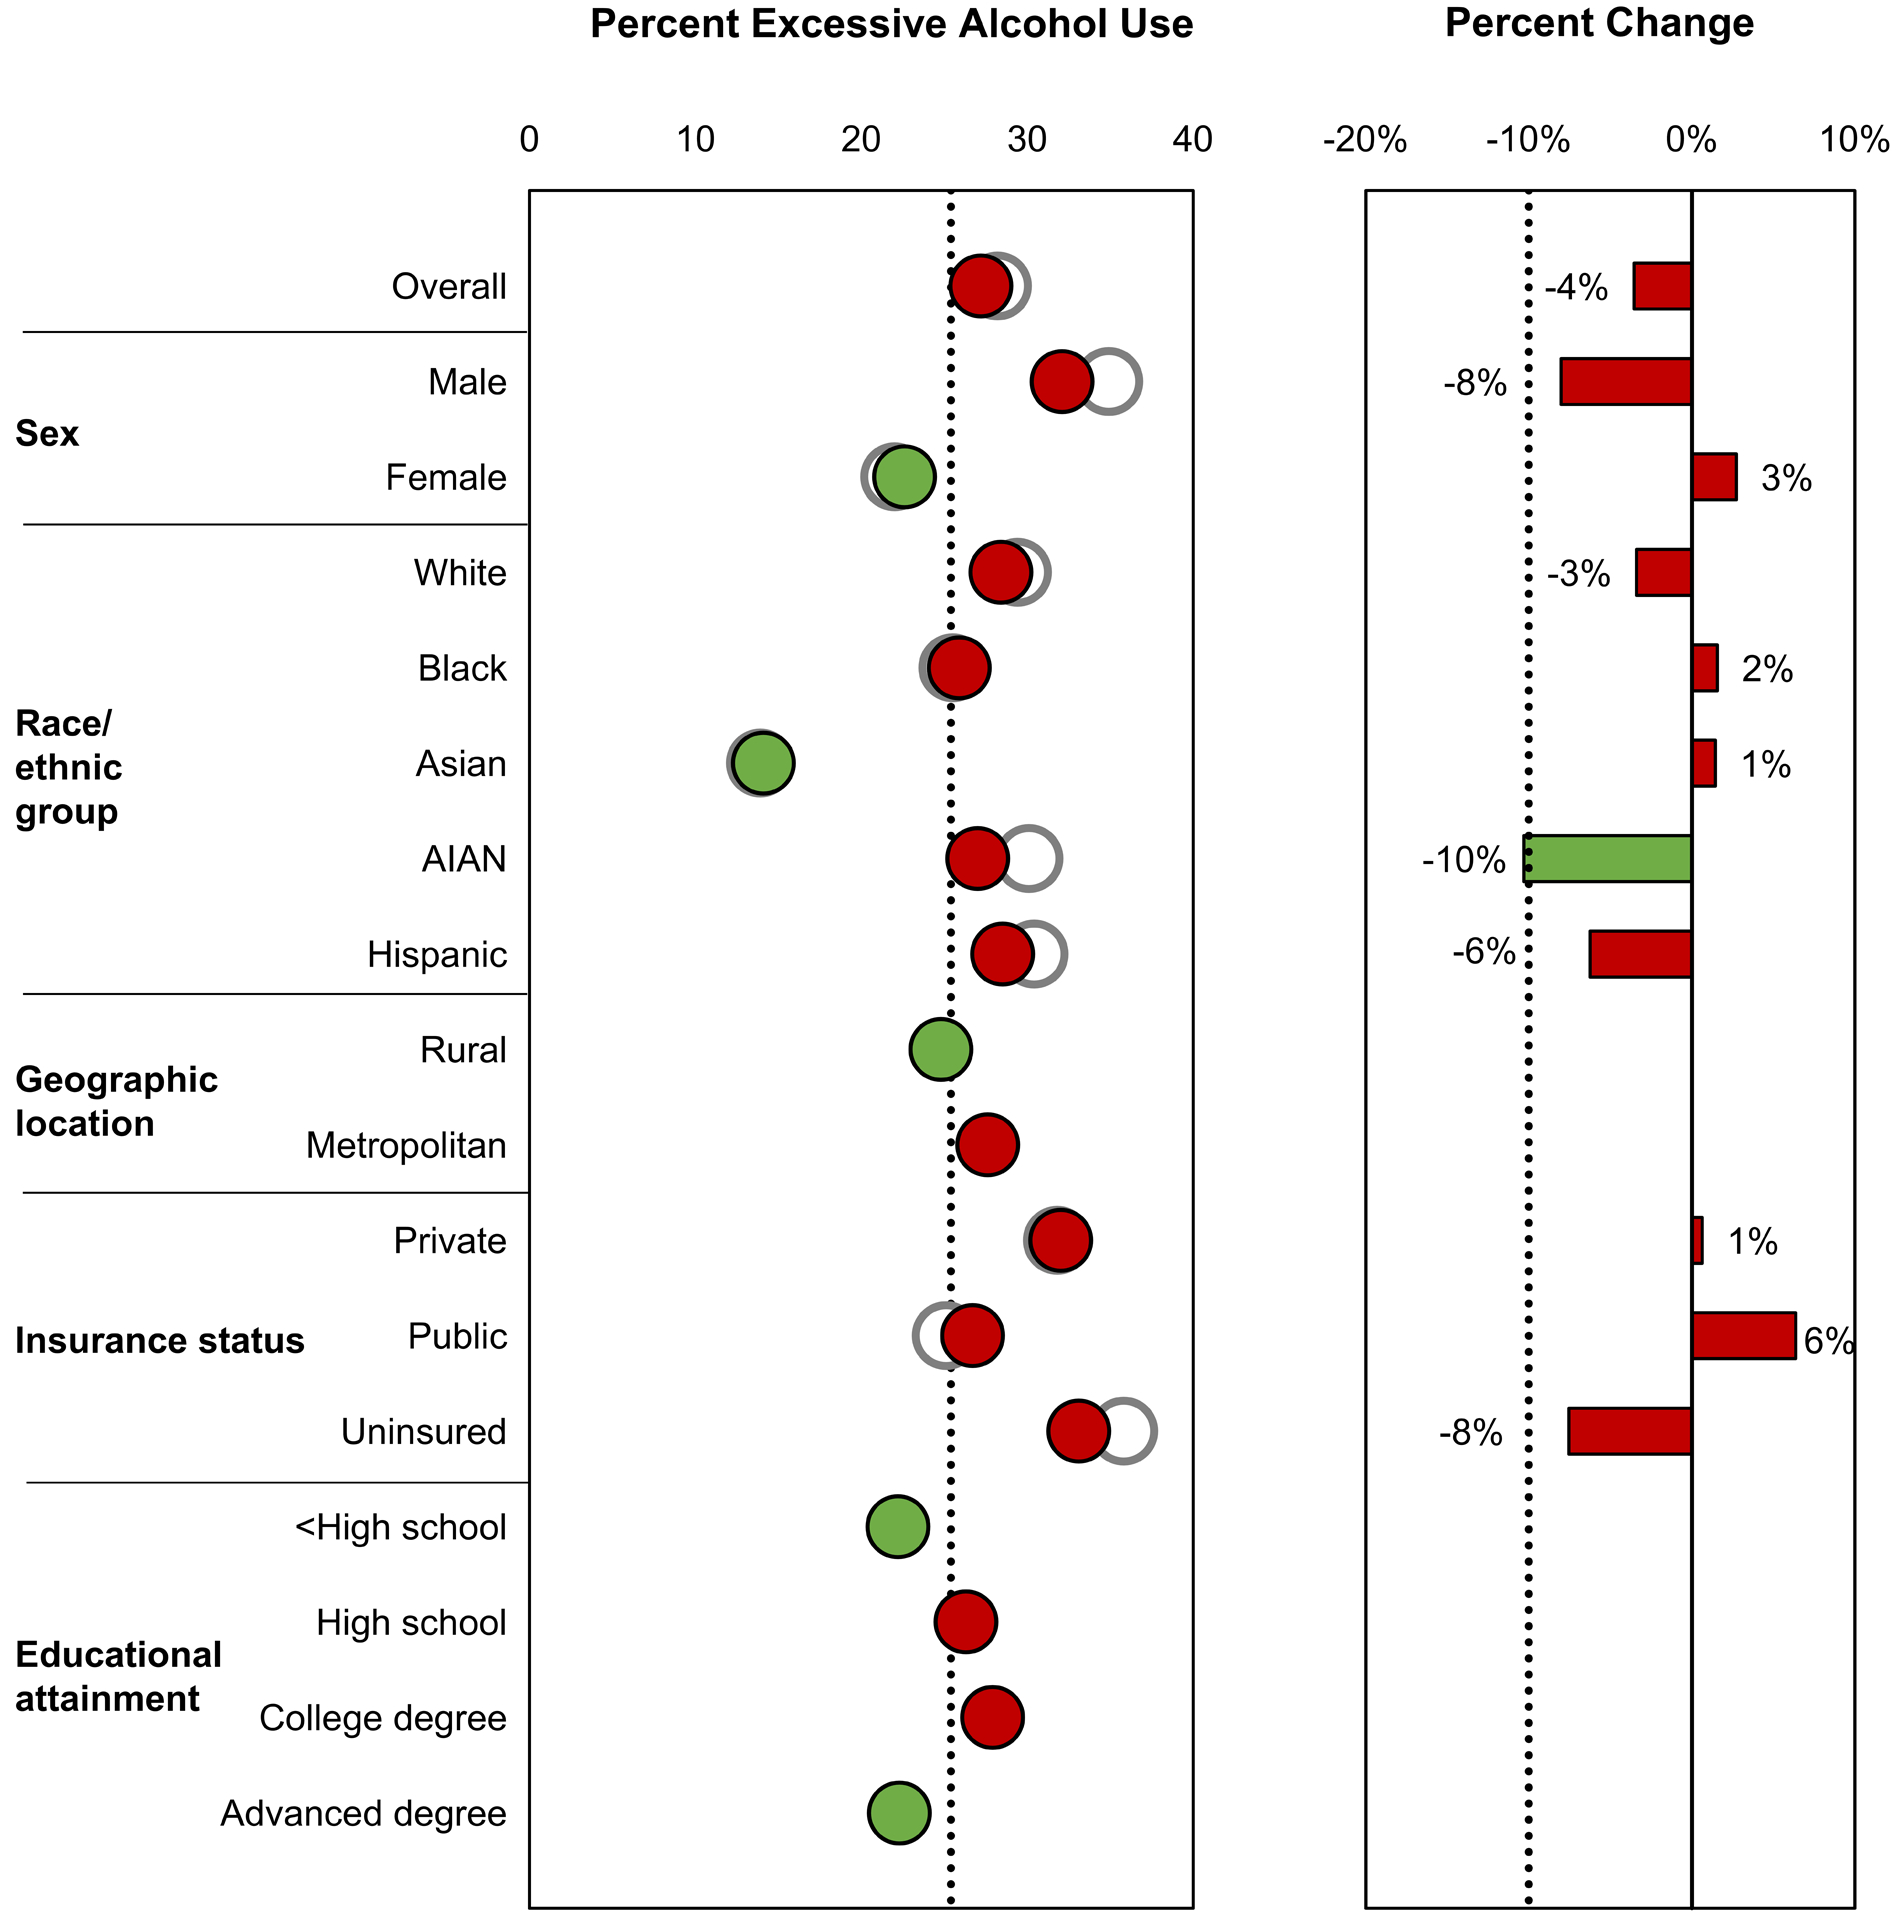
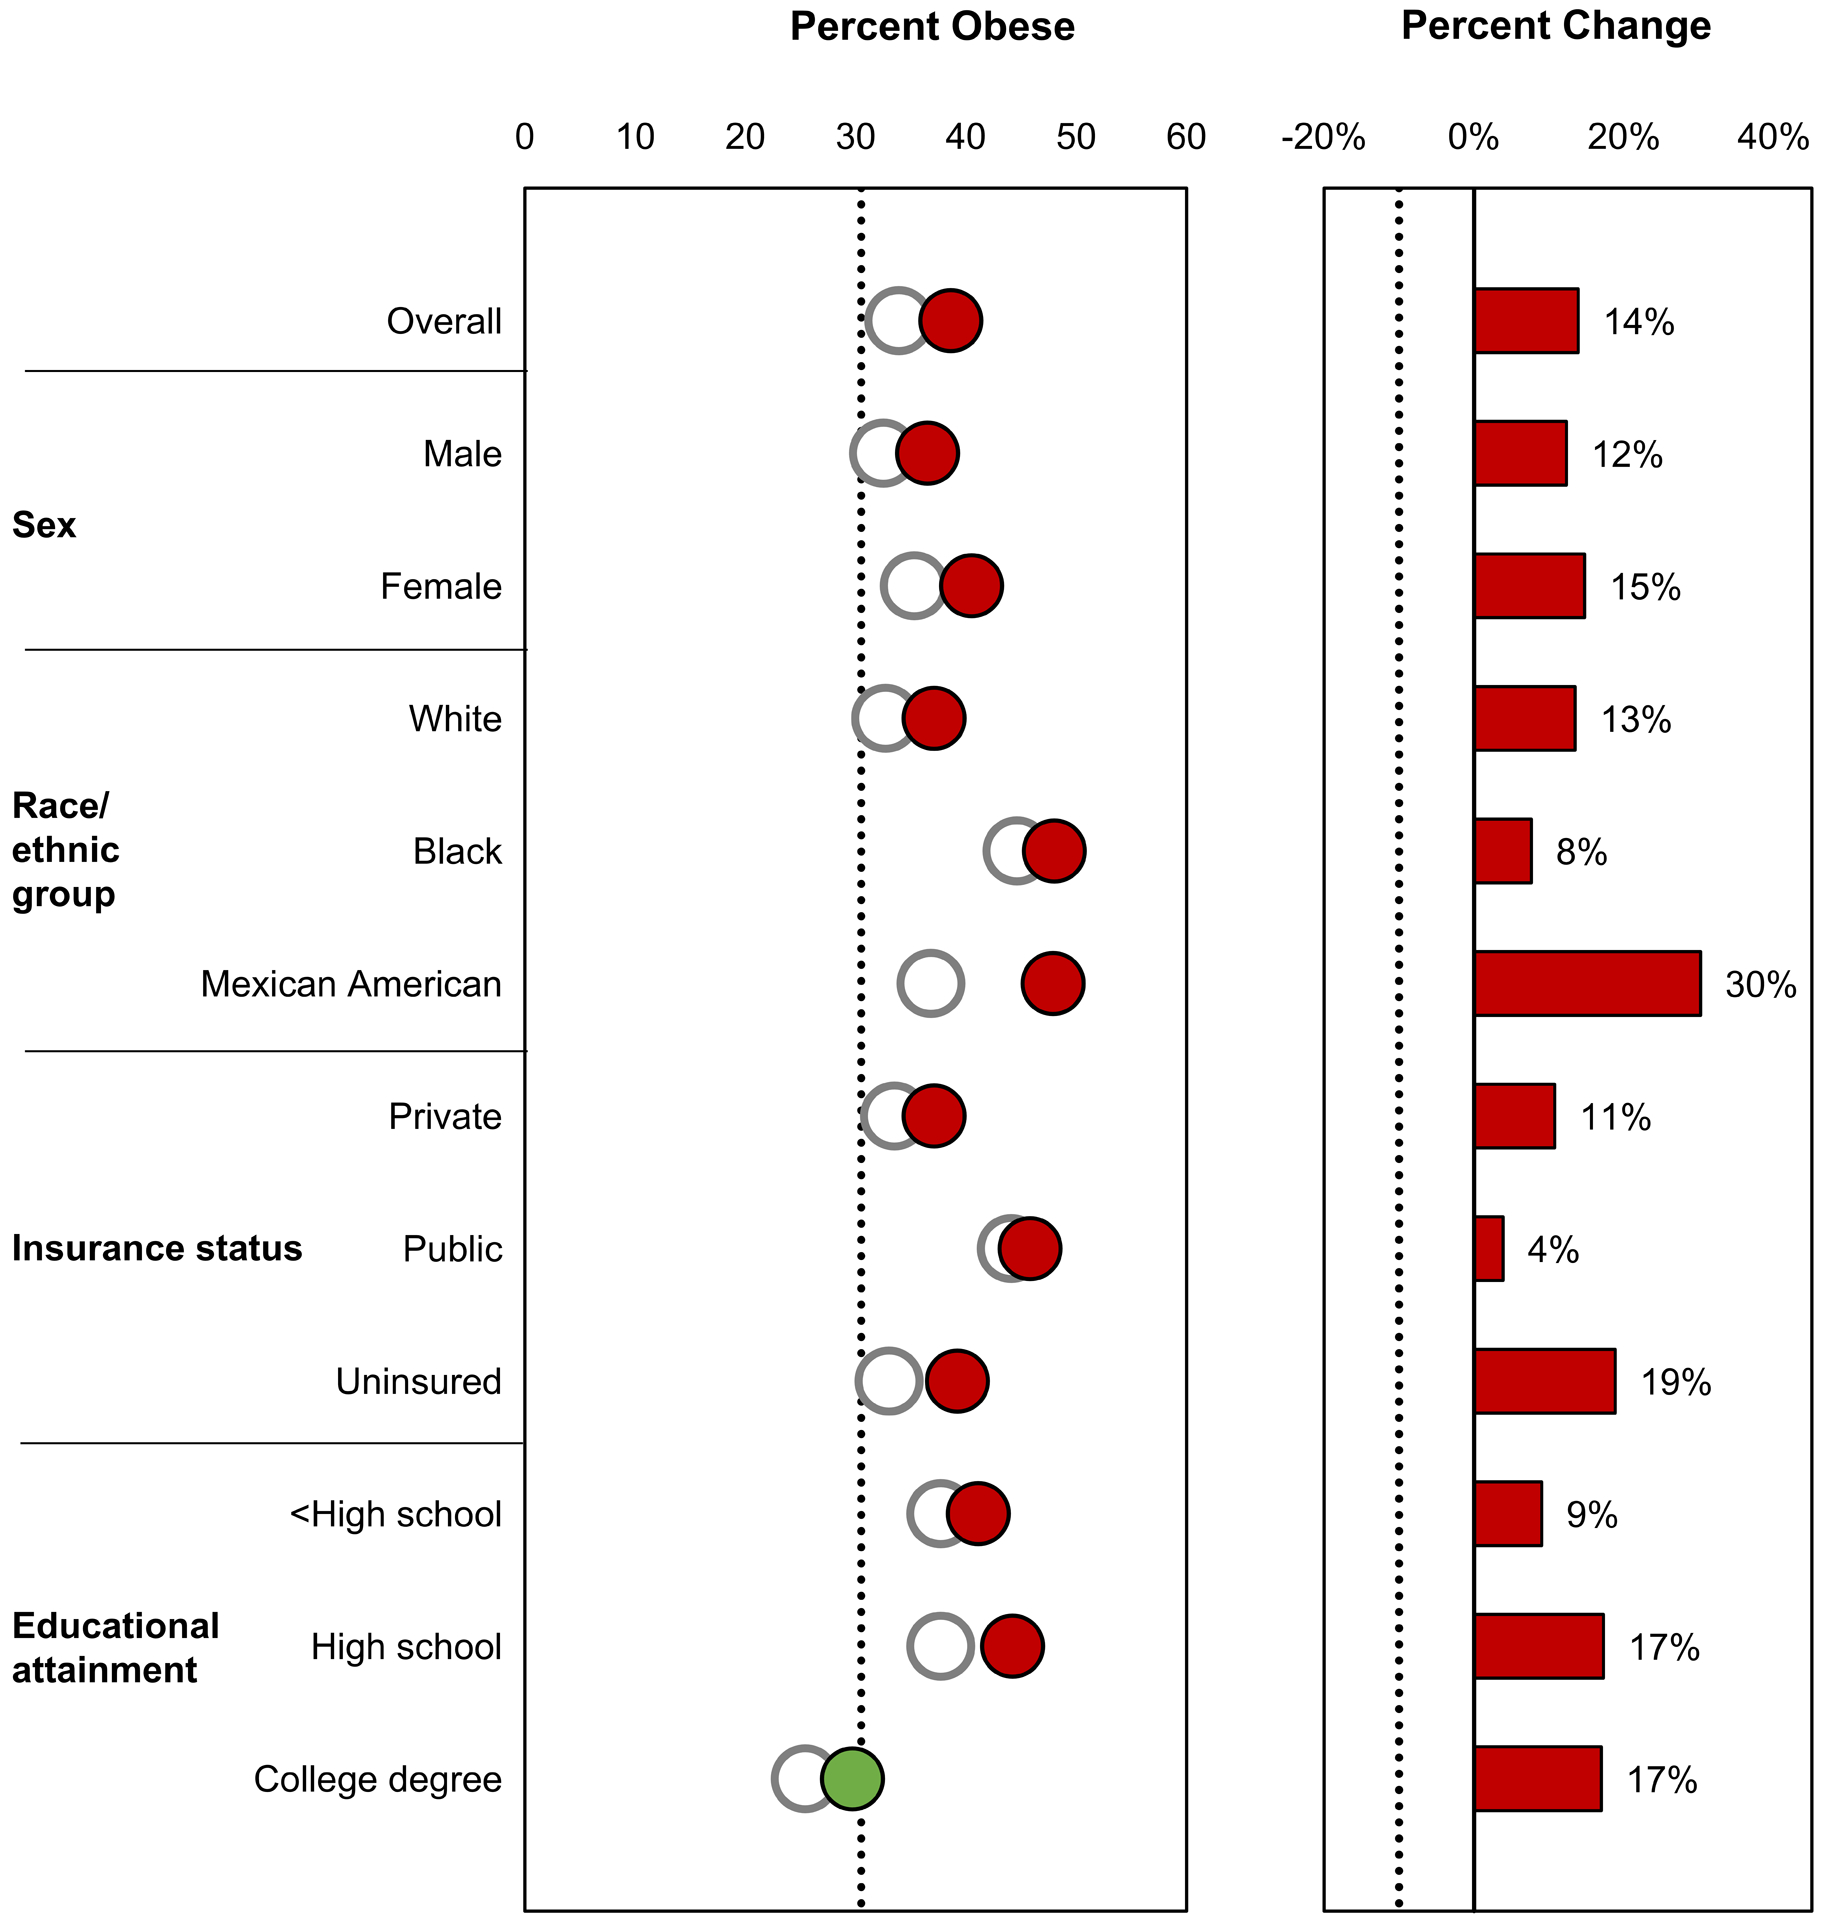
Healthy People 2020 objectives related to cancer risk factors are illustrated. Healthy People 2020 targets are indicated by black dotted lines. The baseline value is indicated as a white circle, and the most recent estimate is indicated as a green circle if the target was met and as a red circle if the target was not met. The percentage change from the baseline value to the most recent estimate is indicated as a green bar if the percentage improvement target was met (or if the percentage change was in the indicated direction when a percentage improvement target was not specified) and as a red bar if the percentage improvement target was not met (or if the percentage change was not in the indicated direction when a percentage improvement target was not specified). The Healthy People 2020 targets are: (A) reduce adult cigarette smoking prevalence from 20.6% in 2008 to 12.0% in 2020 (data are from the National Health Interview Survey; most recent estimates are from 2017); (B) increase recent smoking-cessation success among adult smokers from 6.0% in 2008 to 8.0% in 2020, a 2 percentage point improvement (data are from the National Health Interview Survey; most recent estimates are from 2017); (C) reduce the proportion of adults aged ≥18 years who are exposed to secondhand smoke from 37.6% in 2005 to 2008 to 33.8% in 2020, a 10% improvement (data are from the National Health and Nutrition Examination Survey; most recent estimates are from 2011–2014); (D) reduce the proportion of adults who drank alcohol excessively in the previous 30 days from 28.2% in 2008 to 25.4% in 2020, a 10% improvement (data are from the National Survey on Drug Use and Health; most recent estimates are from 2016; note that baseline values were not available by educational attainment); (E) reduce the proportion of adults who have obesity from 33.9% in 2005 to 2008 to 30.5% in 2020, a 10% improvement (data are from the National Health and Nutrition Examination Survey; most recent estimates are from 2013–2016); and (F) increase the proportion of adults who meet the objectives for aerobic physical activity and for muscle-strengthening activity from 18.2% in 2008 to 20.1% in 2020, a 10% improvement (data are from the National Health Interview Survey; most recent estimates are from 2017). AIAN indicates American Indian/Alaska Native; SHS, secondhand smoke.
