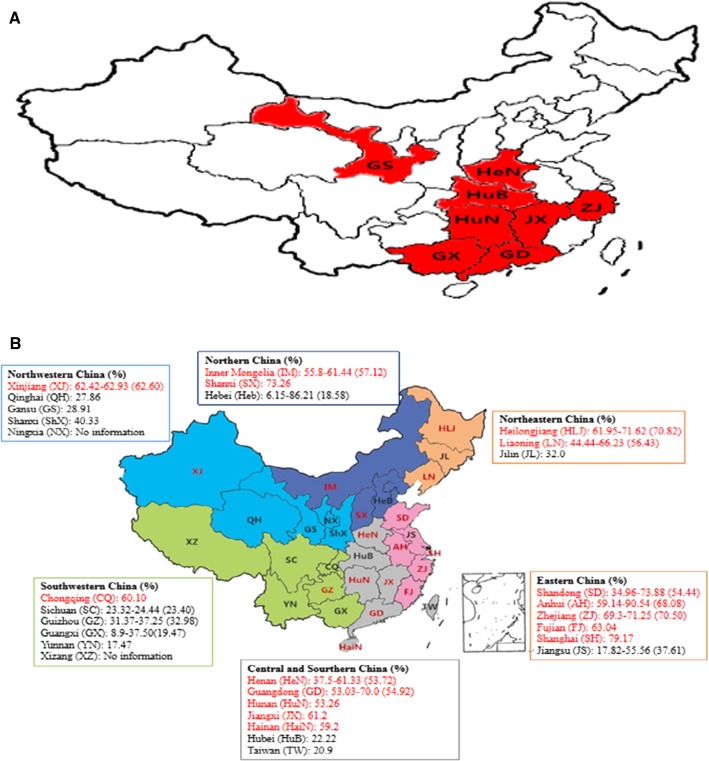
Fig. 1.
Summary of data on PEDV epidemics from the current study and previous studies. (A) Map of China with the eight provinces from which the 184 specimens were collected in the current study shown in red. (B) Results of representative epidemiological studies of PEDV infection conducted in China after 2010, collected from Chinese- and English-language publications, are summarized, analyzed, and displayed on a map of China. The data are divided into six groups according to region (boxes), and the range and average (in parentheses) PEDV infection rates are also indicated. The provinces with an average rate higher than 50% are highlighted in red

