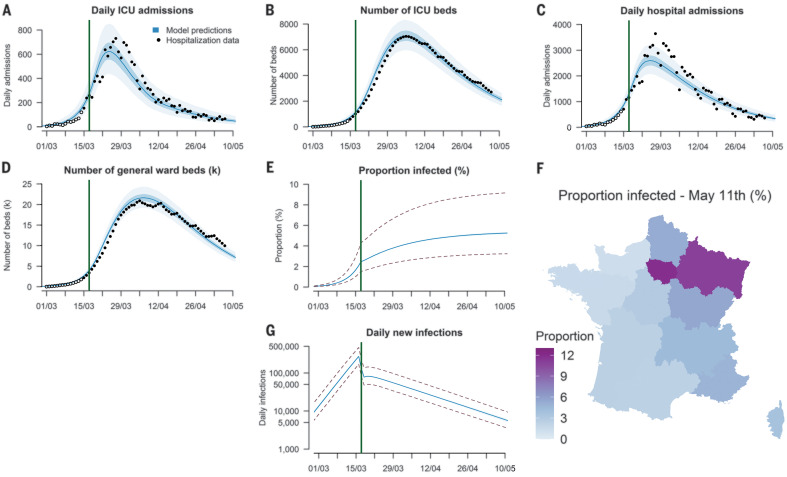
Fig. 3. Time course of the SARS-CoV-2 pandemic to 11 May 2020.
(A) Daily ICU admissions in metropolitan France. (B) Number of ICU beds occupied in metropolitan France. (C) Daily hospital admissions in metropolitan France. (D) Number of general ward beds (in thousands) occupied in metropolitan France. (E) Daily new infections in metropolitan France (logarithmic scale). (F) Predicted proportion of the population infected by 11 May 2020 for each of the 13 regions in metropolitan France. (G) Predicted proportion of the population infected in metropolitan France. The solid circles in (A) to (D) represent hospitalization data used for the calibration, and the open circles represent hospitalization data that were not used for calibration. The dark-blue shaded areas correspond to 50% credible intervals, and the light-blue shaded areas correspond to 95% credible intervals. The dashed lines in (E) and (G) represent the 95% uncertainty range stemming from the uncertainty in the probability of hospitalization after infection.

