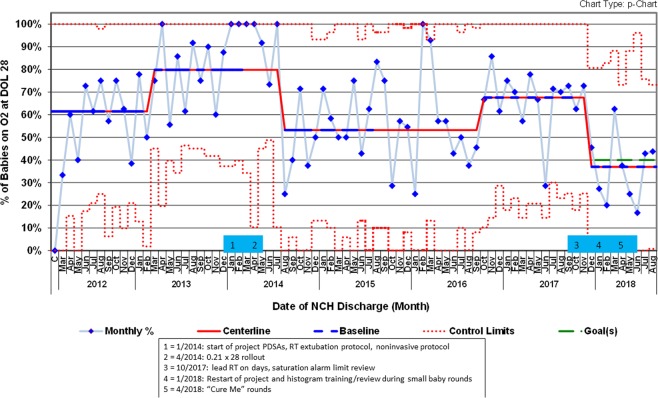
Fig. 1. p control chart showing percent of babies in cohort population requiring oxygen on day-of-life 28.
Solid red = centerline (mean). Dashed blue = points used for baseline calculation. Dashed red = control limits. Dashed green = goal. Shifts meet ASQ rules (March 2013 = 12 out of 14 as July 2013 is above previous centerline; August 2014 = 8 in a row; October 2016 = 8 in a row; December 2017 = 8 in a row). 12 points were used to calculate all centerlines. Centerlines starting in 2013 are 80%, 53%, 68%, and 37%. (Color figure online).

