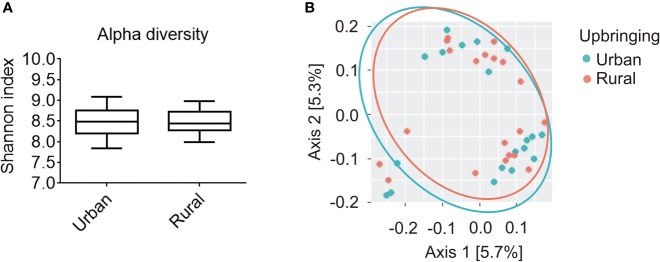
Figure 1.
Alpha and beta diversity analysis of the salivary microbiome composition for participants raised in urban areas in the absence of daily animal contact compared to individuals raised in rural areas in the presence of daily contact with farm animals. (A) Shannon diversity index representing richness and evenness within samples was not significantly different between urban (n = 20) and rural (n = 20) populations (Kruskal-Wallis, p = 0.935). Solid line represents the median. Lower box indicates 25th, upper box indicates 75th percentile. 10th and 90th percentile are indicated by lower and upper error bar, respectively. (B) Weighted UniFrac principal coordinates analysis (PCoA) plot represents beta diversity as phylogenetic distances among samples for both urban (turquoise; n = 20) and rural (orange; n = 20) populations. PCoA axes 1 and 2 explain 5.7 and 5.3% of the variation, respectively.

