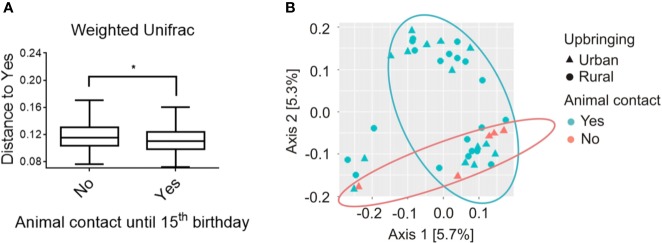
Figure 2.
Beta diversity analysis of salivary microbiome composition for participants with absolutely no animal contact compared to participants that were at minimum exposed to occasional animal contact until the 15th birthday, respectively. (A) Analysis of beta diversity using weighted-UniFrac distance metrics revealed differences in the microbial community structure of participants with no animal contact at all (red, n = 5) compared to participants with at least occasional animal contact until the 15th birthday (blue, n = 35), respectively. Distances to subjects with animal contact (Yes = animal contact; No = No animal contact) are represented by a PERMANOVA analysis with a total of 999 permutations, pseudo-F = 1.988, p = 0.038. Solid line represents the median. Lower box indicates 25th, upper box indicates 75th percentile. 10th and 90th percentile are indicated by lower and upper error bar, respectively. (B) Weighted-UniFrac principal coordinates analysis (PCoA) plot shows participants raised in rural areas in the presence of daily contact with farm animals (circles; n = 20) and participants raised in urban areas in the absence of daily animal contact (triangles; n = 20). Participants were further subdivided into the groups with “absolutely no animal contact until the 15th birthday” (orange, n = 5) or “occasional to daily animal contact until the 15th birthday” (turquoise, n = 35). PCoA axes 1 and 2 explain 5.7 and 5.3% of the variation, respectively. *p < 0.05.

