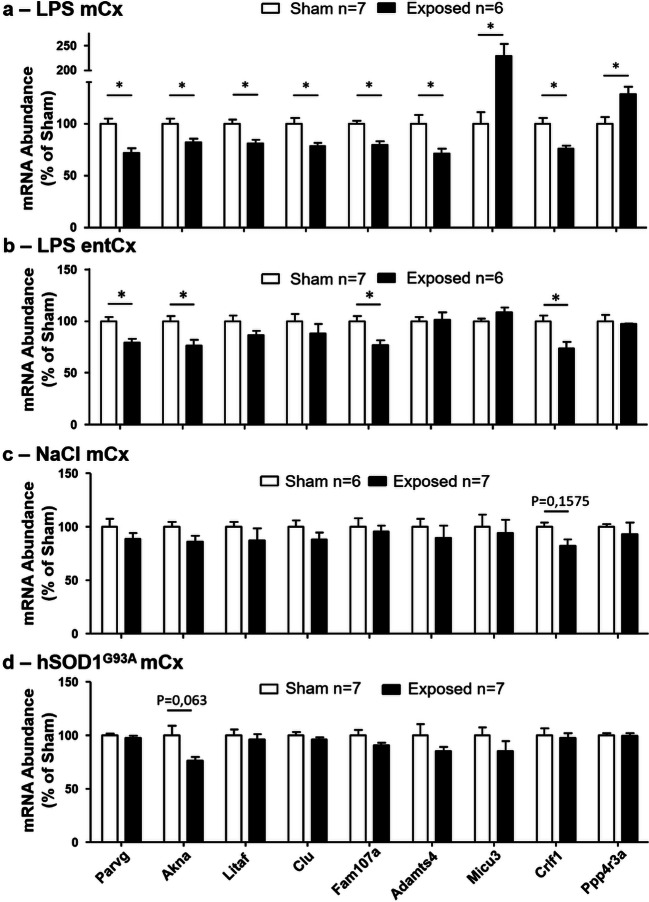
Fig. 4.
RT-qPCR analyses of nine genes selected from RNA-seq data. RNA were extracted from the mCx (a, c, d) or the entCx (b) 24 h after sham or GSM exposure in LPS-injected rats (a, b), control saline-injected rats (c), and in hSOD1G93A rats (d). The mRNA levels were normalized to mean values from sham-exposed animals. Open bars correspond to sham rats, and black bars correspond to GSM-exposed rats. Data are means ± SEM from six or seven animals. *p < 0.05, Mann–Whitney test with Benjamini–Hochberg multiple testing corrections

