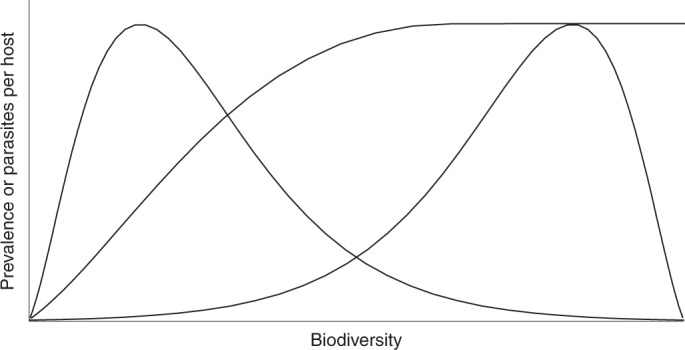
Fig. 3. Hypothetical relationships between biodiversity and disease risk.

The right-skewed distribution suggests that dilution might occur more frequently, but less intensely than amplification because the relationship is moderately negative over a greater portion of the biodiversity gradient than it is strongly positive. The left-skewed distribution suggests that amplification might occur more frequently but less intensely than dilution, because the relationship is moderately positive over a greater portion of the biodiversity gradient than it is strongly negative. An asymptotic distribution suggests that amplification becomes increasingly moderate with biodiversity. In addition to the shape of biodiversity–disease relationships, the frequency with which each biodiversity level occurs in the environment will also affect the likelihood and intensity of dilution and amplification. These hypothetical curves underscore the importance of documenting the shape of biodiversity–disease relationships, which has rarely been accomplished empirically.
