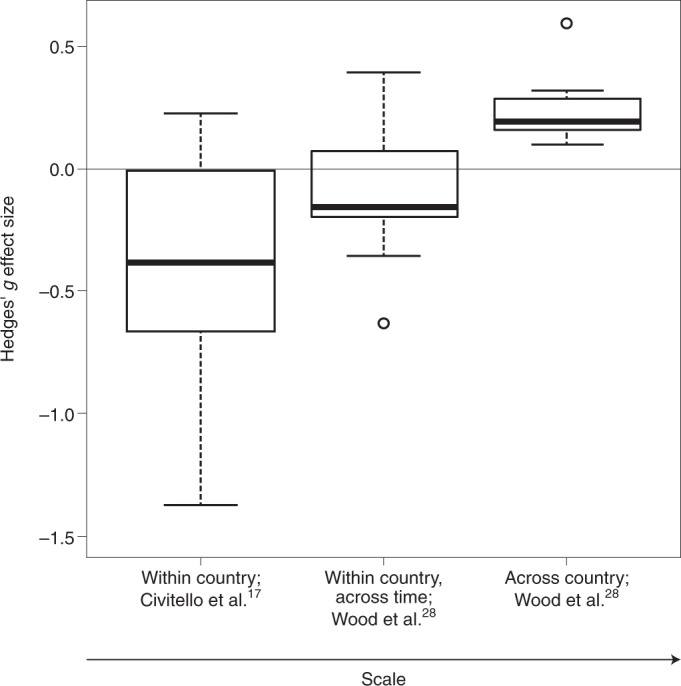
Fig. 4. Hedges’ g effect sizes.

Effect sizes are shown for the association between biodiversity and zoonotic parasites (plus typhoid, because Wood et al.28 suggest it is biodiversity-responsive) at the cross-country and within-country (through time) scales (median replicate size: 321,489 km2; n = 11) from Wood et al.28 and various smaller-scale studies (median replicate size: 1.5 km2; n = 12) compiled by Civitello et al.17. Hedges’ g was provided by Civitello et al.17, whereas Wood et al.28 provided standardized regression coefficients. We converted the standardized regression coefficients to the Hedges’ g used in Civitello et al.17 by multiplying these coefficients by the sample size bias adjustment, . To properly account for the lack of independence among multiple effect sizes within studies and for the same diseases in Civitello et al.17, we calculated a mean effect size for each study weighting by the inverse of the variance, and then used inverse variance weighting on those study-wise means to obtain a weighted mean for each disease (see Source Data Fig. 4 for data used to generate this figure). In the Wood et al.28 study, the cross-country coefficient is significantly greater than zero (z = 5.82, P < 0.001), whereas the within-country (over time) coefficient is negative but not significantly different from zero (z = –1.20, P = 0.116). However, the relationship between these mean coefficients and scale is significantly positive (F1,10 = 13.59, P = 0.0042), indicating that positive diversity–disease associations are more likely for among-country comparisons than for comparisons within a country, over time. Relative to Wood et al.28, smaller-scale studies compiled in Civitello et al.17 were more likely to find negative diversity–disease associations. However, other factors also differ between the Wood et al.28 and Civitello et al.17 studies so we cannot confidently attribute all of this difference to the effect of scale. The midline of each boxplot is the median, the lower and upper limits of the box are first and third quartiles, respectively, the whiskers extend to 1.5 times the interquartile range, and the circles are extreme data points. Note that one extreme Hedges’ g value from Civitello et al.17 at –4.92 (Leptospira spp.) is not shown but was used to calculate the median, quartiles and whiskers of the boxplot.
