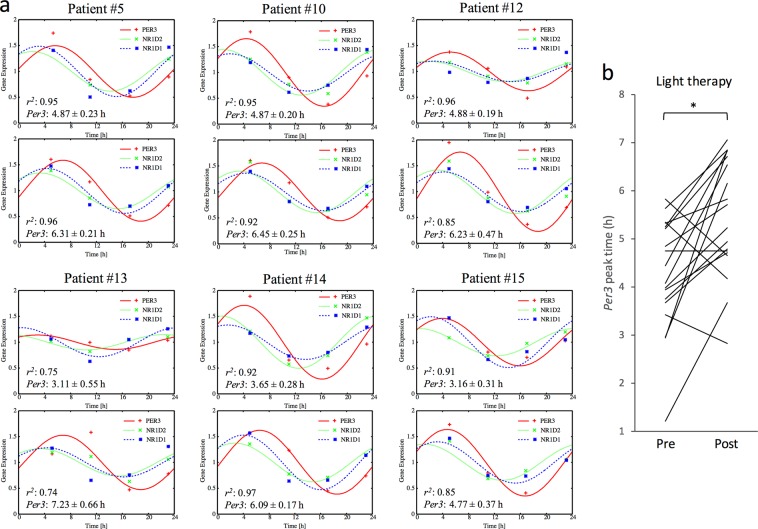
Figure 2.
Effect of BLT on peripheral clock gene expression in PD patients receiving DT. (a) Representative clock gene expression rhythms of PD patients receiving DT before and after BLT (upper and lower panels, respectively). Hair follicles were collected at approximately 6‐hr intervals around the clock, from which total RNA was extracted and subjected to real‐time PCR for quantification of the expression levels of three clock genes (Per3, Nr1d1 and Nr1d2). Expression levels were normalized based on the expression level of 18S ribosomal RNA. A mathematical estimation of peripheral circadian phase was performed based on the expression levels of these three clock genes. Colored curves and dots represent estimation results and experimental measurements, respectively. Estimated peak times in Per3 expression rhythms are shown with the coefficient of determination r2 and 95% confidence interval. (b) Statistical comparison of Per3 peak times in PD patients receiving DT before or after BLT using a paired Student’s t-test (n = 17, *P < 0.01).

