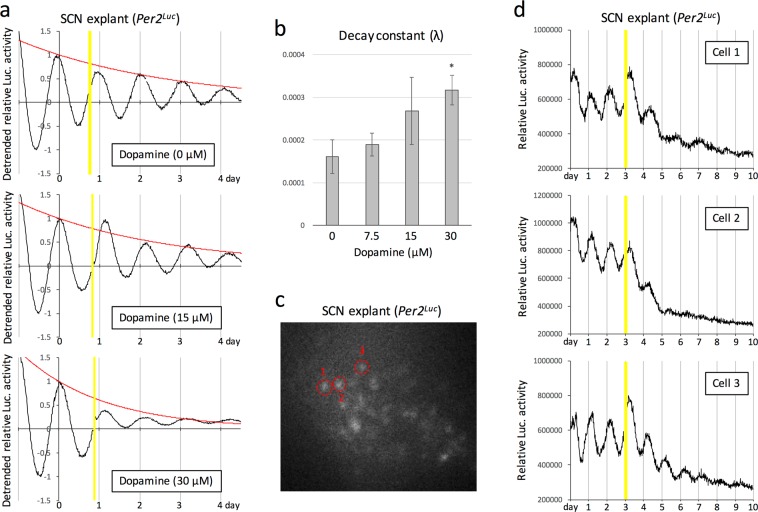
Figure 4.
Effect of chronic dopamine exposure to the SCN on circadian gene expression. (a) Representative bioluminescence rhythms of ex vivo cultured SCN of Per2Luc mice in the presence of indicated concentrations of dopamine. Bioluminescence was measured in real time with a photomultiplier tube, in the presence of 100 μM luciferin. The data sets were detrended by subtracting the 24-h running average from the raw data. Yellow shadows indicate the time spent for dopamine administration. To calculate the decay constant (λ), peak values were fitted to the model equation y(t) = e−λt by a least-squares method (red curve). (b) Statistical evaluation of decay constants (λ) in circadian clock gene expression using an unpaired Student’s t-test (versus 0 μM control, *P < 0.05). (c) A representative image of ex vivo cultured SCN obtained using a luminescence microscope optimized for single-cell imaging. Red circles surrounding individual neurons indicate ROI (region of interest), which was used for quantification of signal intensity in (d). (d) Results from real-time and single-cell imaging of ex vivo cultured SCN in the presence of 30 μM dopamine. The intensity of bioluminescence emitted from each neuron was integrated for 15 min at intervals of 15 min. Yellow shadows indicate the time spent for dopamine administration.

