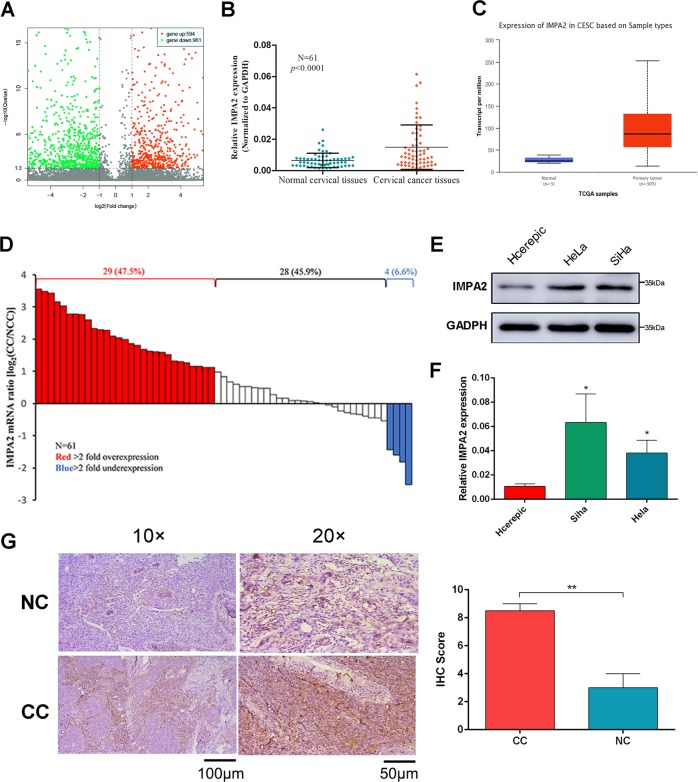
Fig. 1. IMPA2 was overexpressed in cervical cancer tissue and cell lines.
a Volcano plot of differentially expressed genes. b Relative expression of IMPA2 in cervical cancer tissues (n = 61) compared with that of adjacent normal tissues (n = 61) (P < 0.0001). c Expression of IMPA2 in normal and CESC tissues using public data from the TCGA-CESC dataset (Normal vs Primary tumor: P = 0.0004). d Waterfall plot analyses of IMPA2 mRNA levels in CC and matched non-tumor cervical specimens. Red and blue bars represent samples that show a relative IMPA2 fold change of ≥2 overexpression and underexpression, respectively (CC/NT). e IMPA2 expression was determined using western blotting and qRT-PCR (f) in SiHa and Hela cells. g Immunohistochemical (IHC) detection of IMPA2 in normal cervical samples (NC) and cervical cancer samples and the Immunoreactivity scores of IMPA2 were shown. Scale bar, 100 or 50 μm. Values were all presented as mean values ± SD. *P < 0.05.

